
Thermal Interface Materials: An Engineer's Selection Guide
- Jewlz Technologies

- Aug 4
- 16 min read

Thermal interface materials (TIMs) are engineered gap fillers placed between a heat source and a heat sink to reduce contact thermal resistance. The single most important selection rule: minimize contact resistance at your expected bond-line thickness (BLT) and mounting pressure, not just raw bulk conductivity. A TIM with a conductivity of 8 W/m·K that fails to wet your surface will outperform nothing. As a quick orientation: greases and phase-change materials (PCMs) suit thin BLTs under 50 µm; preformed pads and gap fillers handle larger gaps up to several millimeters; metal TIMs and solders serve extreme heat flux applications where mechanical trade-offs are acceptable.
The rule that saves rework: A TIM that wets and conforms to surface asperities will outperform a higher-conductivity material that does not. Specify contact resistance, not just bulk conductivity, on every procurement document.
Table of Contents
Why do electronics get hot, and what do thermal interface materials actually fix?
How do suppliers report TIM performance, and which numbers actually matter?
What standards and datasheet fields should you demand from suppliers?
How do TIM classes compare across the dimensions engineers care about most?
How do you use simulation and measurement to predict and validate TIM performance?
The Thermalysis Toolkit fits directly into your TIM validation workflow
Useful sources for engineers who need primary literature and datasheets
Why do electronics get hot, and what do thermal interface materials actually fix?
Heat generated at a semiconductor junction must travel through a series of resistances before it reaches ambient air. The thermal path runs junction → case → TIM → heat sink → ambient. Each interface adds resistance, and the TIM sits at one of the most controllable points in that chain.
The problem is surface roughness. Even machined metal surfaces are microscopically jagged. When two surfaces press together, actual contact occurs at only a fraction of the apparent area. The gaps between asperities fill with air, and air conducts heat at roughly 0.026 W/m·K. That is roughly 10,000 times worse than copper. A TIM displaces that air with a material that wets into the surface texture, cutting contact resistance by orders of magnitude.
Thermal resistance in context: For a 10 mm × 10 mm interface with a 50 µm BLT and a TIM conductivity of 5 W/m·K, R = L / (k × A) = 0.00005 / (5 × 0.0001) = 0.1 °C/W. Add contact resistances on both faces and total impedance rises further — which is why BLT and wetting matter as much as the conductivity number on the datasheet.
Total thermal impedance has two components: bulk resistance (driven by conductivity and thickness) and contact resistance (driven by surface finish, wetting, and mounting pressure). In many real assemblies, contact resistance dominates. A Honeywell application note makes this explicit: the ability to wet and conform to surface asperities often matters more than the bulk conductivity value. Increasing mounting pressure compresses the TIM into surface valleys, reduces effective BLT, and measurably lowers Rθcs. This is why specifying clamp force or screw torque alongside TIM type is not optional.
For a deeper look at the underlying heat transfer equations that govern this path, Jewlztech’s engineering guide covers the math in detail.
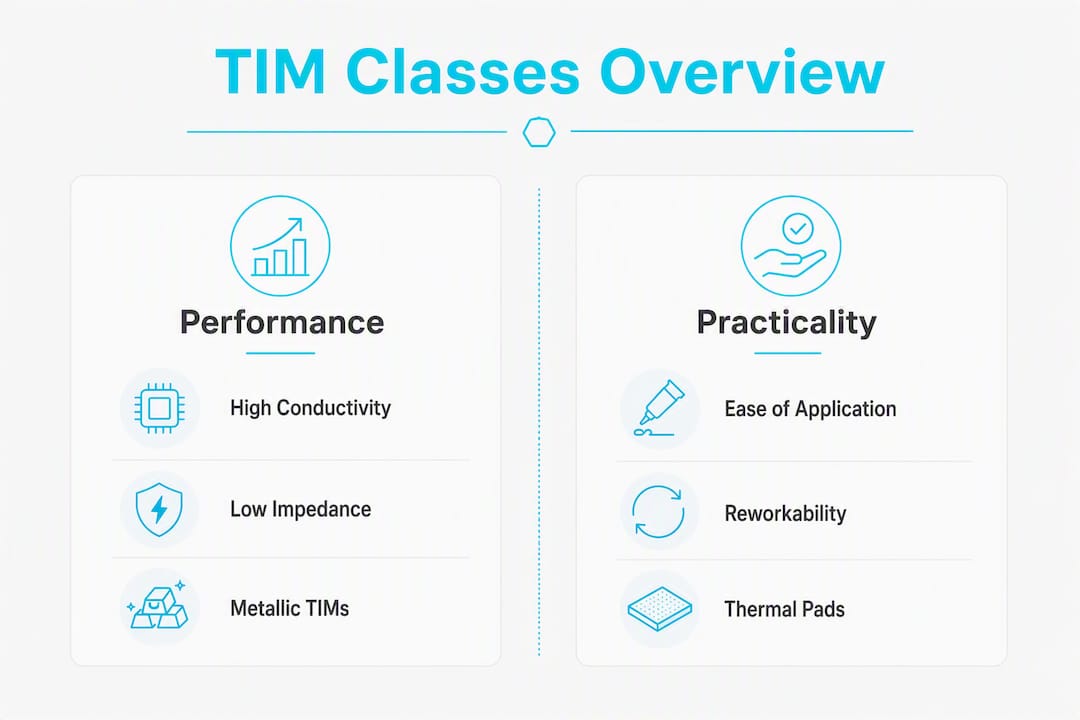
What are the main types of thermal interface materials?
The six major TIM classes each occupy a different region of the performance-versus-practicality space. Understanding where each sits prevents over-specifying for simple applications and under-specifying for demanding ones.
Thermal grease and paste
Thermal grease is the most widely used TIM class. It conforms well to surface irregularities, achieves thin BLTs, and requires no curing. Bulk thermal conductivities typically run in a moderate low-to-mid range with some advanced metallic-filler formulations reaching higher values. Arctic Silver 5, for example, uses micronized silver particles to push conductivity toward the upper end of the typical range. The trade-off is long-term reliability: grease migrates under thermal cycling, a failure mode called pump-out, which progressively increases junction temperature over the device’s life.
Engineering trade-offs:
Excellent wetting and conformability at thin BLT
No bonding, so full reworkability
Pump-out and phase separation degrade performance over thermal cycles
Requires controlled dispensing volume to avoid excess that contaminates nearby components
Thermal gels
Gels are a middle ground between grease and cured adhesives. They are typically silicone-based with ceramic or metallic fillers, and they can be dispensed and then lightly cured to reduce migration. Conductivity ranges overlap with greases. They are less prone to pump-out than straight grease but still reworkable, making them popular in server and telecom hardware where field replacement is expected.
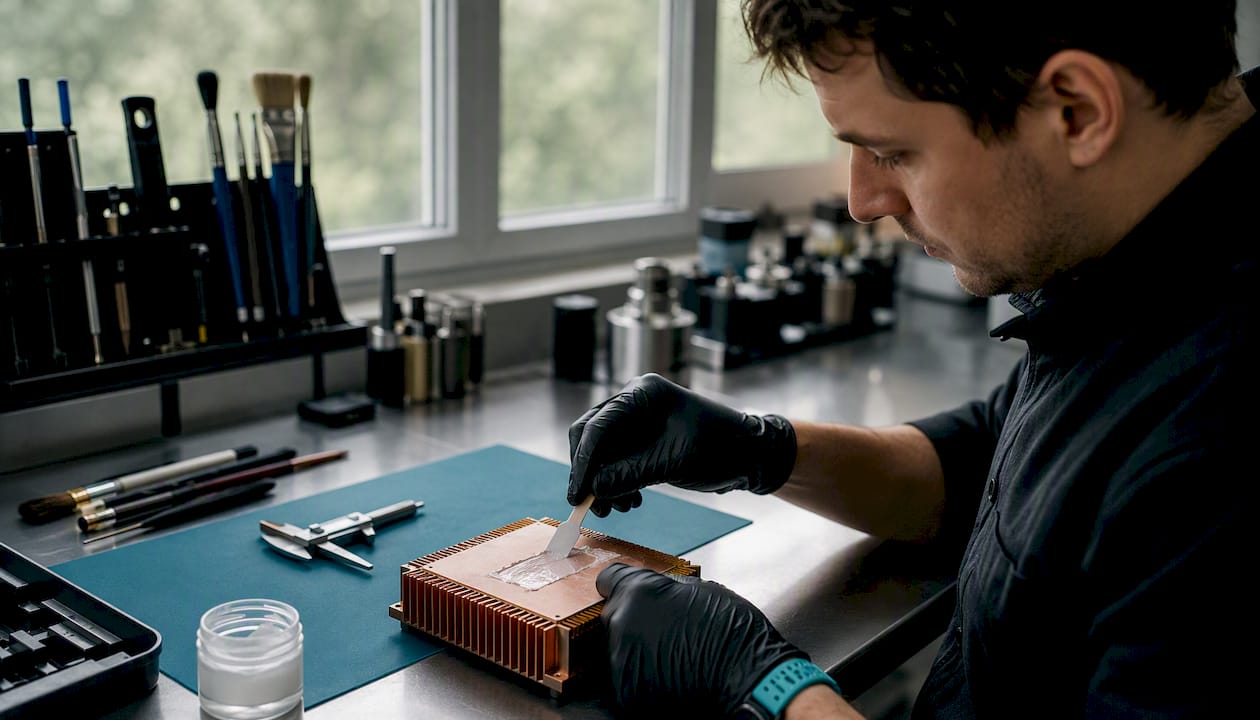
Thermally conductive adhesives (TCAs)
TCAs bond the heat source to the heat sink permanently, eliminating the need for separate mechanical fasteners in some designs. Henkel’s Loctite line includes several epoxy and silicone-based TCAs with conductivities in the 1–6 W/m·K range. The bonding strength is a feature in vibration-heavy environments and a liability when rework is needed. Once cured, removal risks component damage.
Engineering trade-offs:
Structural bond eliminates fastener hardware
No reworkability after cure
Suitable for LED assemblies and power modules where mechanical fixturing is impractical
Outgassing during cure must be characterized for sensitive optical or vacuum applications
Preformed pads and gap fillers
Gap fillers are typically silicone-based, available in thicknesses from 0.25 mm to 5 mm, and offer thermal conductivity from 0.5 to 10 W/m·K depending on filler loading. Laird Performance Materials is a major supplier in this category, offering pads that can cover multiple heat sources in a single preform. They are easy to handle, require no dispensing equipment, and are reworkable. The downside is that they require sufficient clamping pressure to achieve rated conductivity, and they cannot match the thin BLTs that grease achieves.
Engineering trade-offs:
Consistent BLT from part to part, good for automated assembly
Reworkable and easy to inspect
Higher contact resistance than grease at equivalent pressure
Best suited for gaps of 0.5 mm and above
Phase-change materials (PCMs)
PCMs are solid at room temperature and melt slightly above it, typically between 50°C and 80°C, flowing into surface asperities like a grease once the device warms up. This gives them grease-like performance at operating temperature with solid-state handling convenience. 3M produces several PCM pads widely used in consumer electronics and power supplies. Nano-enhanced phase-change materials (NePCMs) add nanoparticles to improve both conductivity and latent heat capacity, making them increasingly attractive for high-density electronics thermal buffering.
Engineering trade-offs:
Solid handling, liquid-like performance at temperature
Good reworkability before first thermal cycle
Pump-out risk increases after repeated cycling
NePCM variants add cost but improve buffering in transient-heavy loads
Metal TIMs and solders
Metal TIMs achieve some of the lowest contact resistances available and are used where heat flux density exceeds what polymer-based materials can handle. Indium Corporation supplies indium foil and solder-based TIMs used in high-power RF amplifiers, laser diodes, and advanced processor packaging. The mechanical trade-off is significant: solder TIMs are stiff, and differential thermal expansion between the die and heat spreader can induce fatigue cracking over thermal cycles. They are also essentially permanent, so rework requires reflowing.
Engineering trade-offs:
Lowest thermal resistance of any TIM class
Mechanical stiffness introduces fatigue risk under thermal cycling
Requires controlled reflow process and flux management
Reserved for extreme flux applications where polymer TIMs are insufficient
Data table: TIM class performance at a glance
TIM Class | Typical Conductivity (W/m·K) | Typical BLT Range | Reworkable | Primary Failure Mode |
Thermal grease/paste | 2–10 (up to ~17 with metallic fillers) | 50–100 µm | Yes | Pump-out, phase separation |
Thermal gel | 2–10 (typically) | 50–200 µm | Yes (partially) | Migration, phase separation |
Conductive adhesive | 1–6 | 50–300 µm | No | Delamination, cracking |
Gap filler / pad | 0.5–10 | 0.25–5 mm | Yes | Compression set, delamination |
Phase-change material | 1–8; higher when nano-enhanced | 50–150 µm | Yes (limited) | Pump-out after cycling |
Metal TIM / solder | >17 (very high) | 10–100 µm | No (reflow) | Fatigue cracking |
How do suppliers report TIM performance, and which numbers actually matter?
Datasheets from 3M, Laird, Henkel, and others report thermal conductivity (k) and thermal resistance or impedance (Rθ or °C·cm²/W). These are not interchangeable, and conflating them is one of the most common specification errors.
Thermal conductivity (k) is a material property, measured in W/m·K, independent of geometry. It tells you how well the bulk material conducts heat. It does not tell you how the TIM will perform in your assembly.
Thermal resistance ® is a system property. R = L / (k × A), where L is BLT and A is contact area. For a 1 cm² interface, R in °C/W = (BLT in meters) / k. Thermal impedance (°C·cm²/W) normalizes by area and is the more useful comparison metric across different interface sizes.
Contact resistance adds to bulk resistance on both the top and bottom faces of the TIM. Total impedance = bulk resistance + contact resistance (top face) + contact resistance (bottom face). This is why a TIM with k = 10 W/m·K can show higher total impedance than a k = 5 W/m·K material that wets better.
ASTM D5470 is the primary laboratory method for measuring TIM thermal resistance, and most major suppliers reference it on datasheets. The critical caveat: ASTM D5470 results depend heavily on test BLT, applied pressure, and temperature. A datasheet that reports conductivity without specifying these conditions is not usable for design.
Datasheet checklist — require these fields from every supplier:
Thermal conductivity (k) in W/m·K, with filler type identified
Thermal impedance (°C·cm²/W) at stated BLT and stated pressure
Test method cited (ASTM D5470 or equivalent)
Test temperature and temperature range
Dielectric strength (V/mil or kV/mm) for electrically insulating applications
Operating temperature range (minimum and maximum)
Outgassing data (especially for vacuum or optical environments)
Aging or thermal cycling data (number of cycles, delta impedance)
Recommended clamp force or torque range
Shelf life and storage conditions
How should you select a TIM for your application?
TIM selection is a multifactor trade-off: no single material wins across all dimensions. The checklist below ranks criteria by their typical impact on junction temperature.
Contact resistance and wetting. This is the dominant variable in most assemblies. Prioritize materials with documented low impedance at your expected BLT and pressure, not the highest k on the shelf.
Bond-line thickness fit. Match the TIM class to your gap. Greases and PCMs for gaps under 100 µm; pads and gap fillers for 0.25 mm and above. Mismatching BLT to TIM class is a common cause of poor field performance.
Operating temperature range. Confirm the TIM’s rated range covers your junction temperature at maximum load, plus margin. Silicone-based pads typically handle up to 200°C; some greases degrade above 150°C.
Mechanical environment. Vibration and shock loads favor bonding TIMs (TCAs) or pads with adhesive backing. Non-bonding greases can migrate under sustained vibration.
Electrical insulation requirements. Most polymer TIMs are dielectric. Metal TIMs and silver-filled greases are electrically conductive. Confirm dielectric strength if the TIM bridges electrically live surfaces.
Reworkability. Field-serviceable products require reworkable TIMs. Adhesive TIMs and solder TIMs are effectively permanent.
Production volume and cost. Grease requires dispensing equipment and process control. Pads and preforms are faster in automated assembly. At high volume, process yield and consistency often outweigh material unit cost.
Supplier questions to standardize before selection:
At what BLT and pressure was impedance measured?
Is aging data available (thermal cycling, damp heat)?
What is the recommended clamp force or torque range?
Are qualification samples available in production-representative form?
What is the shelf life and storage requirement?
Red flags: A datasheet with no test conditions is unusable. Vague aging language (“tested for reliability”) with no cycle count or delta impedance is a warning sign. Any silver-filled or metal-particle TIM described as “electrically insulating” without a dielectric strength value requires verification before use in insulated applications.
For engineers also weighing active versus passive cooling at the system level, TIM selection interacts directly with heat sink sizing and airflow decisions.
How do you apply TIMs correctly and verify performance?
Application quality determines whether a TIM performs anywhere near its datasheet value. The most common field failure is not a bad material — it is a good material applied incorrectly.
Surface preparation
Clean both mating surfaces with isopropyl alcohol (IPA, 99% purity preferred) and a lint-free wipe. Residual contamination from previous TIM, flux, or handling oils creates a barrier that no amount of clamping pressure overcomes. For metal TIMs and solders, surface oxidation must be removed and flux applied per the supplier’s process note.
Application by TIM type
Grease and gel: apply a controlled volume at the center of the heat source and allow spreading under clamping pressure. The “pea” or “cross” pattern works for square dies; a thin pre-spread layer works better for large, irregular surfaces. Target BLT is set by the clamping hardware, not by eye.
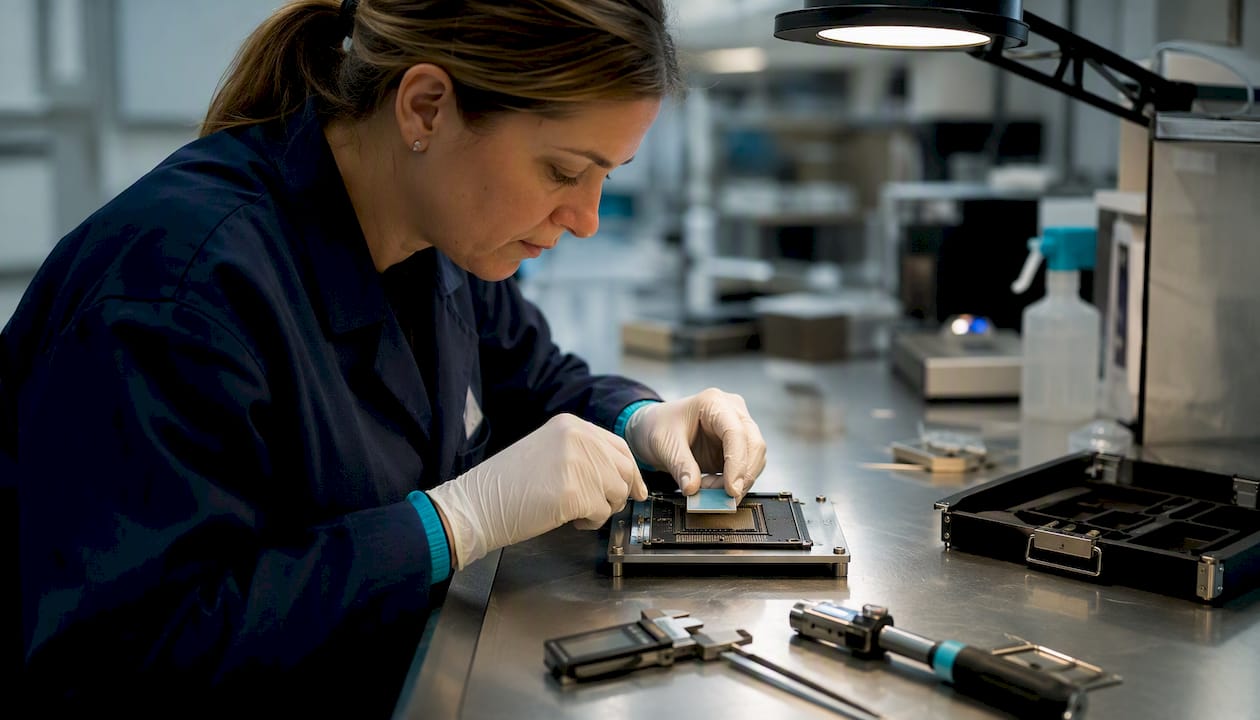
Pads and gap fillers: peel the liner, place the pad, and apply clamping hardware. Confirm the pad is not folded or bridging a gap it was not sized for. Oversized pads that overhang component edges can create stress concentrations.
Adhesive TIMs: follow the supplier’s pot life and cure schedule exactly. Partial cure produces unpredictable bond strength and thermal performance.
Mounting hardware and contact pressure
Mounting hardware and consistent torque specification have immediate, measurable effects on thermal resistance. Clips and spring-loaded fasteners maintain consistent pressure across temperature cycles; rigid screws torqued unevenly create pressure gradients that show up as hot spots. Specify torque ranges in assembly travelers, not just nominal values. For power packages, onsemi’s mounting guide documents how torque variation maps to Rθjc variation.
Pro Tip: Use a calibrated torque driver and torque in a star pattern on multi-fastener heat sinks. A 20% torque variation across fasteners can produce measurable junction temperature differences in high-power devices.
Verifying performance after assembly
Steady-state thermal measurement: compare junction-to-ambient resistance against the modeled value. A delta greater than 10–15% warrants investigation.
Thermal imaging: infrared cameras reveal hot spots caused by voids, insufficient coverage, or uneven clamping.
Thermal cycling acceptance: run accelerated cycles (typically 0°C to 100°C or per the product’s use-case profile) and re-measure impedance. Pump-out and phase separation are detectable as a rising junction temperature trend over cycles.
Mechanical inspection: cross-section or X-ray imaging can confirm BLT and detect voids in adhesive or solder TIMs.
Which applications call for which TIM class?
The right TIM class depends on the thermal flux, gap geometry, mechanical environment, and serviceability requirement of the application. Here is how common use cases map to TIM choices.
CPUs and GPUs (consumer and server). Thin BLT, high flux, reworkable. Thermal grease (e.g., Arctic Silver, Shin-Etsu X-23) or PCM pads dominate. Server designs increasingly use high-conductivity gels for better pump-out resistance than straight grease.
Power electronics (IGBTs, MOSFETs, power modules). Moderate to high flux, often electrically insulated. Gap fillers and thermally conductive pads from Laird or 3M are common. Bonding TIMs (TCAs) suit modules where mechanical fasteners are impractical. Solder TIMs appear in the highest-flux power modules.
LED assemblies. Low to moderate flux, permanent bond often preferred, vibration tolerance needed. TCAs from Henkel’s Loctite line are widely used. The bond also serves as a mechanical attachment, eliminating a separate adhesive step.
Battery thermal management. Large gaps, distributed heat sources, compression-tolerant. Gap fillers in the 1–3 mm range with moderate conductivity (1–5 W/m·K) are standard. The TIM must accommodate cell swelling over charge cycles without delaminating.
RF amplifiers and laser diodes. Extreme flux density, small die area, tight junction temperature budget. Metal TIMs (indium foil, solder) from Indium Corporation are the typical choice despite the mechanical trade-offs. The conductivity advantage is simply too large to ignore at these flux levels.
High-density computing and AI accelerators. NePCMs and advanced carbon-filled TIMs are gaining traction here, driven by the need for both high conductivity and thermal buffering during burst workloads.
What standards and datasheet fields should you demand from suppliers?
Standards give you a common language for comparing supplier claims. Without them, two datasheets reporting “thermal conductivity = 6 W/m·K” may have been measured under completely different conditions.
Key standards:
ASTM D5470: The primary method for measuring TIM thermal resistance in a laboratory stack. Measures impedance at controlled BLT, pressure, and temperature. Most major TIM suppliers reference this method. Understand that results are condition-specific — a value at 50 psi and 100 µm BLT does not predict performance at 20 psi and 300 µm BLT.
ASTM E1461: Flash diffusivity method for measuring bulk thermal conductivity. Often used for pad and gap filler characterization.
IEC 60112: Comparative tracking index, relevant for dielectric TIMs in high-voltage applications.
MIL-STD-810: Environmental testing (thermal cycling, vibration, humidity) referenced in defense and aerospace TIM qualifications.
Datasheet fields to insist on:
Test BLT and applied pressure for every impedance value
Test method (ASTM D5470 or equivalent) cited explicitly
Operating temperature range (minimum and maximum, not just “up to X°C”)
Dielectric strength (V/mil) and volume resistivity for insulating TIMs
Outgassing data (TML and CVCM per ASTM E595 for space or optical applications)
Thermal cycling data: number of cycles, temperature range, and reported delta impedance
Recommended clamp force or torque range
Shelf life and storage conditions (temperature, humidity)
RFQ checklist template — paste into supplier evaluation forms:
Provide ASTM D5470 impedance data at [your BLT] and [your pressure]
Provide aging data: minimum 500 thermal cycles, delta impedance reported
Confirm dielectric strength if TIM bridges live surfaces
Provide outgassing data if application is vacuum or optical
Confirm shelf life and storage requirements
Provide application note or process guide for dispensing/placement
How do TIM classes compare across the dimensions engineers care about most?
TIM Class | Conductivity (W/m·K) | Impedance (°C·cm²/W) | Best For | Typical BLT | Mechanical Behavior | Electrical | Reworkable | Temp Range | Application Ease |
Thermal grease/paste | 2–10 (up to ~17 with metallic fillers) | Low (thin BLT) | CPUs, GPUs, power devices | 50–100 µm | Non-bonding | Varies (some conductive) | Yes | Up to mid-temperature range | Moderate (dispensing) |
Thermal gel | 2–10 (typically) | Low–moderate | Servers, telecom | 50–200 µm | Non-bonding | Dielectric | Partial | Up to mid-temperature range | Moderate |
Conductive adhesive | 1–6 | Moderate | LEDs, power modules | 50–300 µm | Bonding (permanent) | Dielectric (most) | No | Up to mid-temperature range | Moderate (cure step) |
Gap filler / pad | 0.5–10 | Moderate–high | Battery, power electronics | 0.25–5 mm | Non-bonding | Dielectric | Yes | Up to mid-temperature range | Easy (preform) |
Phase-change material | 1–8; higher when nano-enhanced | Low at temp | Consumer electronics, PSUs | 50–150 µm | Non-bonding | Dielectric | Limited | Moderate temperature range | Easy (preform) |
Metal TIM / solder | >17 (very high) | Very low | RF, laser, extreme flux | 10–100 µm | Bonding (reflow) | Conductive | No (reflow) | Up to higher temperature range | Difficult (reflow) |
Impedance values are qualitative because they depend on BLT, pressure, and surface finish — always compare at identical test conditions.
How do you use simulation and measurement to predict and validate TIM performance?
Committing to a TIM without modeling its sensitivity to BLT variation and mounting pressure is how engineers end up with field failures that were predictable on paper. A reproducible workflow closes that gap.
Step-by-step validation workflow:
Characterize mating surfaces. Measure surface roughness (Ra) on both the heat source and heat sink. Ra values above 1.6 µm typically require a conformable TIM; harder pads may not wet adequately.
Define BLT range. Establish the minimum and maximum BLT your assembly tolerances allow. This is not a single number — it is a range driven by flatness, warpage, and fastener torque variation.
Run 1D/2D conduction models. Use a physics-based toolkit to compute junction temperature across the BLT range. Jewlztech’s Thermalysis Toolkit supports variable material properties and multiple heat transfer modes, making it well suited for this sensitivity sweep. Model contact resistance as a function of pressure using supplier data or published correlations.
Calibrate with lab measurements. Build a representative test stack and measure thermal impedance at your target BLT and torque. Compare against the model. A discrepancy greater than 15% usually points to a contact resistance assumption that needs revision.
Validate with thermal cycling. Run accelerated thermal cycles on assembled hardware. Re-measure impedance at intervals (e.g., 0, 100, 500, 1000 cycles). Rising impedance indicates pump-out or delamination.
Set acceptance criteria. Define a maximum allowable junction temperature and a maximum allowable impedance increase over the product’s expected thermal cycle count. These become your production test limits.
Pro Tip: Model BLT sensitivity before selecting a TIM class. If a 50 µm BLT variation shifts junction temperature by more than 5°C in your model, your assembly process needs tighter flatness control — or you need a more conformable TIM that is less sensitive to BLT variation.
For engineers evaluating simulation toolchains beyond 1D models, Jewlztech’s overview of simulation software alternatives covers options for more complex coupled thermal analyses.
Key Takeaways
Contact resistance, not bulk conductivity, is the dominant variable in most real TIM assemblies — specify impedance at your actual BLT and pressure, not just the k value on the datasheet.
Point | Details |
Contact resistance dominates | Wetting and conformability at your BLT and pressure matter more than raw conductivity. |
Match TIM class to BLT | Use greases or PCMs for BLTs under 100 µm; pads and gap fillers for gaps of 0.25–5 mm. |
Demand test conditions | Require ASTM D5470 impedance data at your specific BLT and pressure from every supplier. |
Plan for aging | Include thermal cycling data (delta impedance over 500+ cycles) in every RFQ to catch pump-out early. |
Jewlztech Thermalysis Toolkit | Run BLT and contact resistance sensitivity studies before committing to a supplier using the Thermalysis Toolkit. |
The part of TIM selection most engineers underestimate
The thermal conductivity number on a datasheet is the most cited and least useful figure in TIM selection. Engineers spend hours comparing k values across suppliers while the actual junction temperature difference between a 5 W/m·K and an 8 W/m·K material, at the same BLT and pressure, is often smaller than the variation caused by a 10% torque inconsistency on the mounting screws.
What actually determines field performance is the combination of surface finish, mounting hardware consistency, and whether the TIM class was matched to the gap geometry. A pad specified for a 0.5 mm gap, forced into a 0.1 mm gap by an overly tight fastener, will not perform anywhere near its datasheet value. Neither will a grease applied at twice the recommended volume because the assembler was being cautious.
The other underestimated factor is aging transparency. Suppliers who report only initial impedance and not delta impedance after thermal cycling are telling you something. Pump-out in grease and phase separation in gels are well-documented failure modes, and any supplier with a mature product should have cycling data. If they do not, that absence is itself a data point.
Mounting hardware deserves more attention than it usually gets. Specifying a TIM without specifying the torque range and fastener type is like specifying a gasket without specifying bolt preload. The contact pressure the TIM sees is set by the hardware, not by the material itself, and that pressure directly determines whether the TIM reaches its rated impedance.
The practical lesson: build a short simulation model of your assembly before you order samples. Sweep BLT from minimum to maximum tolerance. Sweep contact resistance from best-case (well-wetted, correct pressure) to worst-case (dry contact, low pressure). The junction temperature range that comes out of that sweep tells you how much margin you actually have, and whether the TIM class you are considering is the right one or just the familiar one.
The Thermalysis Toolkit fits directly into your TIM validation workflow
Engineers who have worked through the selection and simulation steps above know the bottleneck: building a credible sensitivity model takes time, especially when material properties need to be varied across BLT, pressure, and temperature simultaneously.

The Jewlztech Thermalysis Toolkit is built for exactly this stage. It handles conduction, convection, and radiation analysis in a single Excel-based environment, supports variable material properties across a wide temperature range, and includes a built-in property database that covers common TIM materials. You can run a BLT sensitivity sweep, compare contact resistance scenarios, and generate a documented simulation report without writing a line of code. That report becomes the reference you use to evaluate supplier datasheets and set production acceptance limits.
For engineers who need to move from “which TIM class?” to “which supplier, at which BLT, with which torque spec?” the Toolkit compresses that workflow from days to hours. Download a sample report or start a subscription at the Thermalysis Toolkit product page.
Useful sources for engineers who need primary literature and datasheets
ASTM D5470 (ASTM International) — The primary standard for measuring TIM thermal resistance. Download the method to understand test conditions before interpreting any supplier datasheet.
onsemi AND9859 — Power Packages Heat Sink Mounting Guide — Detailed guidance on mounting hardware, torque ranges, and how contact pressure affects Rθjc. Required reading before specifying fastener hardware alongside a TIM.
Elsevier Review — Thermal Interface Materials: A Promising Solution for Passive Heat Dissipation — Peer-reviewed survey of TIM classes, failure modes (pump-out, phase separation), and emerging materials including NePCMs. Use this to back material selection decisions with published research.
ScienceDirect — NePCM Research Article — Primary research on nano-enhanced phase-change materials for high-density electronics. Useful for engineers evaluating NePCMs for transient-heavy applications.
Engineering Toolbox — Thermal Conductivity of Materials — Quick reference for conductivity values including air (0.026 W/m·K). Use for sanity-checking material property inputs in simulation models.
NIST — Thermal Conductivity of Selected Materials — Primary reference data for metals and nonmetals. Use when you need traceable conductivity values for simulation inputs rather than vendor-reported figures.
Jewlztech — Heat Transfer Model: Engineering Guide — Covers the equations and modeling approaches that underpin TIM thermal resistance calculations, including R = L / (k × A) worked examples.
Press Fit Tolerances: A Practical Guide for Engineers — Relevant for engineers specifying mechanical tolerances that affect BLT and contact pressure in TIM assemblies.
Recommended
Comments