
For Engineers: Heat Exchanger Fouling Checklist to Save $40,000–$50,000

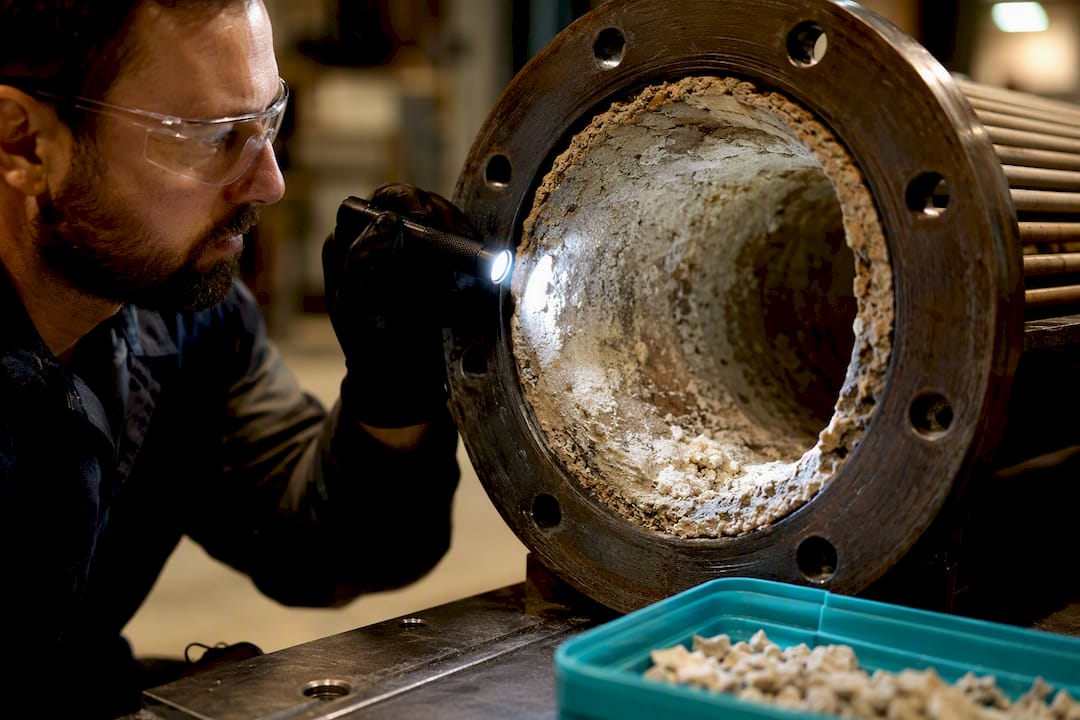
Fouling is the buildup of unwanted deposits on heat-transfer surfaces that drives down the overall heat transfer coefficient (Uf), raises pressure drop, and eventually forces a shutdown for cleaning. It happens whenever deposition outpaces removal, and removal depends mostly on wall shear stress. The moment you see heat duty drift or ΔP climb above baseline, pull your trend logs, check for visible deposits at the next inspection window, and start tracking outlet temperature against design.
TL;DR:
Fouling typically occurs when deposition exceeds removal, with wall shear stress playing a key role in cleaning effectiveness; raising flow velocity can reduce fouling rates.
Crystallization, particulate, chemical, corrosion, biological, and solidification are the main fouling mechanisms, often occurring together and complicating mitigation strategies.
Accurate baseline performance data and flow velocity checks are crucial, as low velocities often cause unexpected fouling more than chemical issues.
Prevention is most effective when integrated into design, with considerations like flow targets, filtration, and fouling margins tailored to actual water chemistry and operating conditions.
Simulation tools enable pre-emptive assessment of fouling risks by testing flow and temperature variations, reducing reliance on reactive cleaning.
Table of Contents
Types and Mechanisms of Fouling in Heat Exchangers
Every fouling problem traces back to one of a handful of mechanisms, and identifying which one you’re dealing with determines whether you reach for acid, a brush, or a metallurgist.
Crystallization (scaling) fouling happens when a dissolved salt, most commonly calcium carbonate, calcium sulfate, or silica, exceeds its solubility limit at the wall and precipitates out. It starts with nucleation at microscopic surface imperfections, then grows through bulk crystallization as more solute deposits on existing crystal sites. Research on crystallization fouling identifies it as often the most damaging fouling mechanism in aqueous systems, partly because the crystal layer bonds tightly to the metal and resists ordinary flushing.
Particulate fouling is deposition of suspended solids, dust, silt, corrosion products, that settle out of the fluid stream, usually in low-velocity zones or immediately downstream of flow disturbances. It’s the most common fouling type across industrial cooling systems, and feed streams carrying more than about 1 ppm of particulate matter routinely cause measurable performance loss.
Chemical reaction fouling covers deposits formed by reactions happening at or near the heat-transfer surface itself, polymerization of hydrocarbons, coking in high-temperature process streams, or oxidation of organics against a hot wall. Unlike scaling, this fouling grows because the chemistry changes at the surface, not because a solubility limit gets crossed.
Corrosion fouling occurs when the tube or plate material reacts with the fluid, and the resulting oxide or sulfide layer itself becomes a fouling deposit, one that also thins the metal and creates a rougher surface that traps more debris.
Biological fouling is microbial slime, algae, or shellfish larvae colonizing a wetted surface, especially common in once-through cooling systems pulling from rivers, lakes, or seawater.
Solidification fouling happens when a component of the process fluid, often wax, grease, or a high-pour-point hydrocarbon, freezes onto a surface that’s colder than its solidification point.
A few practical notes on how these mechanisms actually show up in the field:
Adhesion strength varies enormously: crystalline scale can require acid to remove, while loose silt washes off with mechanical brushing alone.
Growth typically follows an induction period, a slow initial buildup, followed by an accelerating phase once the deposit surface itself becomes rougher and stickier.
Most real exchangers experience composite fouling, two or more mechanisms acting simultaneously, which is why a single-cause diagnosis is often wrong.
Cooling water systems frequently combine particulate, biological, and crystallization fouling in the same unit, which is exactly why plant chemists dose biocides and scale inhibitors together rather than picking one.
That last point deserves emphasis. Composite fouling is the normal case, not the exception, in most industrial cooling and process water systems, and any mitigation plan built around a single mechanism will underperform.
Causes and Operating Factors That Control Fouling Rates
Fouling rate is a balance between deposition and removal, and removal is governed almost entirely by wall shear stress. Raise the shear at the surface, whether by increasing velocity or redesigning flow geometry, and you tip the balance toward removal. Every operating variable below acts on one side of that balance or the other.
Temperature matters in two ways. Bulk fluid temperature affects reaction rates and solubility, and local surface temperature, which is often significantly hotter than the bulk fluid on the process side, drives supersaturation right at the wall where crystals actually nucleate. A tube wall running 15 to 20 degrees Fahrenheit hotter than the bulk stream can trigger scaling long before the bulk fluid chemistry looks like a problem on paper.
Flow velocity and turbulence control both deposition and removal simultaneously. Higher velocity increases wall shear stress, which strips loosely bound deposits, but it also raises particle impact frequency and pumping energy. Most water-side design guidance targets velocities in the 3 to 8 feet per second range for tube-side flow; go much lower and you invite sedimentation in dead zones, go much higher and you risk erosion.
Residence time in low-flow zones, headers, baffled corners, expansion joints, gives particulates and crystals time to settle before shear can remove them. This is why fouling often concentrates at flow reversals and tube inlet/outlet regions rather than spreading evenly across a surface.
Fluid chemistry and solids load set the raw material available for deposition. Hardness ions, dissolved silica, suspended solids concentration, and pH all determine how close a stream sits to its fouling threshold.
Surface condition, metallurgy, and roughness influence nucleation site density. A pitted or scratched surface gives crystals and particles more places to anchor, and a surface prone to corrosion adds its own fouling layer on top of whatever the process fluid contributes.
Deposition and removal are competing rates; net fouling only accumulates when deposition wins.
Local wall temperature, not bulk fluid temperature, usually determines where scaling starts.
Velocities below design minimums are one of the most common root causes of unexpected fouling in field troubleshooting.
Elevated suspended solids concentration is a leading indicator of particulate fouling risk well before ΔP shows it.
Rougher, corroded, or poorly finished surfaces foul faster than smooth ones, all else being equal.
Pro Tip: When troubleshooting a fouled exchanger, check velocity first. A surprising number of “chemistry” fouling problems trace back to a flow maldistribution that dropped local velocity below the design minimum in one pass or one row of tubes.
Effects, Costs, and Performance Indicators of Fouling
Fouling shows up first as a drop in the overall heat transfer coefficient, and that drop is exactly what the fouling factor in your design calculation was meant to anticipate. Designers size a “clean” coefficient (Uc) and then apply a fouling margin to get the design coefficient (Uf), using the relationship Uf = Uc/(1 + fouling margin). That margin is a bet on how much performance headroom you’ll need before the next cleaning.
The hydraulic side often gets worse faster than the thermal side. As deposits thicken, flow area shrinks, pressure drop rises, and in the worst cases full plugging cuts off entire passes or tube rows. A partially plugged shell-and-tube bundle doesn’t just lose heat transfer evenly; it redistributes flow toward the remaining open passages, accelerating erosion there while starving the fouled section further.
By the numbers: Industry estimates put the cost of a single reactive chemical cleaning event at roughly $40,000 to $50,000 per exchanger, once you count chemicals, downtime, and labor. That figure alone explains why prevention-focused design pays for itself over the life of a unit.
Watch two categories of indicators, and don’t rely on just one:
Thermal indicators: heat duty drift, outlet temperature deviation from design, and a widening gap between calculated and design LMTD.
Hydraulic indicators: pressure drop rising above baseline at a given flow rate, especially when flow-corrected.
Combined signal: heat-transfer metrics often reveal fouling earlier than pressure drop alone, since a thin, low-density deposit layer can measurably reduce Uf before it thickens enough to restrict flow area.
Cost signal: rising fan or pump energy consumption to maintain the same process outlet temperature, a symptom operators frequently miss until the utility bill flags it.
The gap between “detectable on a chart” and “visible to the eye” can be weeks or months, which is exactly why trending beats periodic visual inspection alone.
Detection and Condition Monitoring Techniques
Catching fouling early means comparing current performance against a clean baseline, not against a fixed alarm number pulled from a textbook.
Establish a commissioning baseline. Record Uf, LMTD, and outlet temperatures at known flow rates and inlet conditions right after startup or cleaning, before any deposit has a chance to form.
Normalize trends for flow and load. Raw ΔP or raw outlet temperature is nearly useless on its own; flow-corrected ΔP and load-corrected duty let you compare today’s number against baseline fairly, even as throughput varies.
Deploy the right sensors. Temperature sensors at inlet and outlet, differential pressure transmitters across the exchanger, flow meters on both sides, and, for cooling water loops, conductivity and ion sensors to catch chemistry drift before it turns into scale.
Set rolling-average alarms, not instantaneous ones. A single noisy reading shouldn’t trigger a cleaning call; a seven-day or thirty-day rolling average crossing a threshold, commonly 10 to 15% duty loss or a defined ΔP increase, is a far more reliable trigger.
Run periodic physical inspections. Borescope inspection of tube bores, visual inspection of opened plate packs, and lab analysis of sampled deposits (composition, adhesion strength, thickness) confirm what the trend data is implying and tell you which mechanism you’re actually fighting.
Cross-check fouling resistance curves. Plotting calculated fouling resistance against operating time reveals whether you’re in the slow induction phase or the accelerating growth phase, information that changes how urgently you need to schedule cleaning.
Getting the baseline right matters more than any single measurement technique. An exchanger commissioned during a low-flow test, then compared against high-flow field data, will look artificially fouled from day one.
Cleaning and Mitigation Strategies for Fouled Exchangers
Once fouling is confirmed, the remediation choice depends on deposit type, exchanger geometry, and how much downtime you can absorb.
Chemical cleaning targets specific deposit chemistry. Mineral scale, calcium carbonate and sulfate deposits, generally responds to acid circulation, commonly hydrochloric or nitric acid at controlled concentrations, circulated at moderate temperatures with corrosion inhibitors added to protect the base metal during the process. Organic and biological fouling responds better to alkaline cleaners, which break down protein and microbial matter that acids won’t touch. Get the concentration or temperature wrong and you risk pitting stainless steel or attacking gasket materials in a plate exchanger, so this is not a job for guesswork on unfamiliar metallurgy.
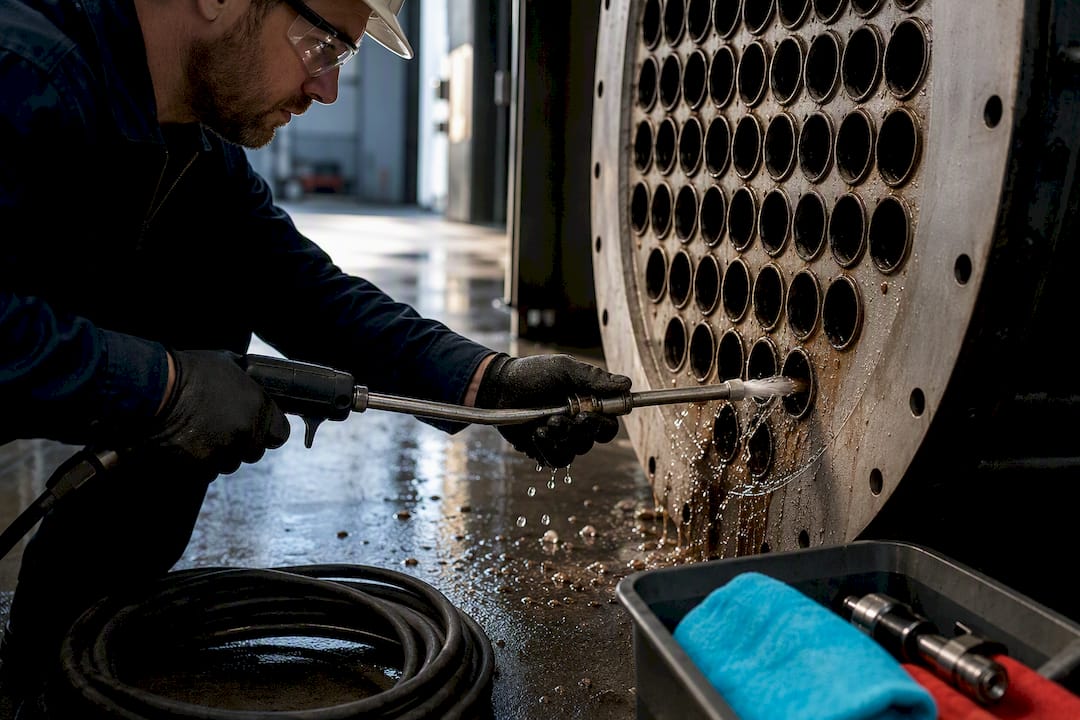
Mechanical cleaning physically removes deposits without chemistry. High-pressure water jetting clears tube bores and plate channels; brushing works well on softer, looser deposits; pigging pushes a scraper through tube runs on larger shell-and-tube units; and full plate-pack disassembly lets you inspect and clean every plate individually, though it takes the unit fully offline. Mechanical methods are usually the answer when deposits are hard, thick, or when chemical compatibility with the process fluid rules out a chemical wash.
Online mitigation keeps the exchanger running while managing fouling in real time. Sponge-ball systems circulate abrasive balls through tube bundles to continuously scour deposits, online chemical dosing suppresses scale formation before it forms, and acoustic or electric antifouling devices claim to disrupt crystal formation, though the evidence for these last two is mixed and site-specific results vary widely. None of these online methods substitutes for periodic offline cleaning; they extend the interval between cleanings, not eliminate the need.
Anti-fouling coatings delay adhesion by altering surface roughness, surface free energy, and wettability. Polymer-based, inorganic, and carbon-based coatings can meaningfully reduce fouling thermal resistance, but every coating has a temperature ceiling and must be matched to the base metal to avoid galvanic or thermal-cycling failure.
Acid cleaning: best for mineral scale, worst for organic or biological deposits.
Alkaline cleaning: best for organic/biological fouling, ineffective on hard mineral scale.
Mechanical jetting or pigging: best for thick, hardened deposits regardless of chemistry.
Online balls or dosing: best as a fouling-rate suppressant between scheduled offline cleanings.
Coatings: best as a preventive layer on new or refurbished equipment, not a fix for existing heavy fouling.
Pro Tip: Match your cleaning method to your deposit sample, not your assumption. A quick lab analysis of a scraped deposit sample, checking for carbonate versus organic versus corrosion-product composition, often saves a full cleaning cycle wasted on the wrong chemistry.
Prevention and Design Considerations for Fouling-Resistant Systems
The cheapest fouling mitigation happens at the design stage, before the exchanger is ever built.
Set fouling factors deliberately, not by habit. The fouling margin you build into Uf calculations should reflect your actual fluid chemistry and cleaning schedule, not a generic textbook value copied from an unrelated service.
Choose the exchanger type with fouling behavior in mind. Plate heat exchangers generate wall shear stresses that can run roughly five times higher than an equivalent shell-and-tube unit, which often lets designers specify a fouling margin of just 5 to 10% instead of the larger margins common on tube-side services, with frame extension capacity available if fouling proves worse than expected.
Add upstream filtration and water treatment. Strainers and backwash filters sized to the expected particle size distribution catch particulate fouling before it ever reaches the exchanger; softening and chemical dosing address hardness and scaling potential in the source water.
Set velocity targets deliberately. Design for the shear stress needed to bias the system toward removal, while respecting the allowable pressure drop and erosion limits for your tube or plate material.
Build in redundancy where downtime is expensive. A spare or parallel exchanger lets you clean one unit while the other carries load, converting an emergency shutdown into a planned maintenance task.
Tie cleaning triggers to trend data, not the calendar. A duty-loss threshold, commonly a 10 to 15% drop from baseline, or a defined ΔP increase gives you an objective cleaning trigger instead of guessing at a fixed interval.
By the numbers: Because plate exchangers can operate with fouling margins as low as 5 to 10% versus much larger margins typical on comparable shell-and-tube duty, switching geometry for a fouling-prone service can shrink the physical footprint and excess area a design otherwise needs to carry.
The upstream controls matter as much as the exchanger design itself. A well-designed PHE fed with unfiltered, hard water will still foul quickly, because the fouling factor only buys you margin, it doesn’t remove the fouling source.
An Engineer’s Checklist for Diagnosing and Solving Fouling
When duty starts drifting or ΔP creeps up, work through this in order rather than jumping straight to a cleaning request.
Pull heat duty, outlet temperature, and flow-corrected ΔP trends against your commissioning baseline.
Check for velocity below design minimums in any pass, header, or low-flow zone.
Sample any accessible deposit and get a quick composition check before choosing a cleaning chemistry.
Confirm upstream filtration and water treatment are performing to spec, not just installed.
Escalate to a planned shutdown when duty loss or ΔP crosses your trending threshold, rather than waiting for a hard trip.
Where simulation earns its keep is in the diagnostic gap between “something is wrong” and “here’s exactly why.” CFD analysis can reveal low-shear stagnation zones and localized hot spots that a bulk-average calculation completely hides, and comparing plate corrugation patterns or tube layouts virtually is far cheaper than fabricating and testing physical alternatives. Useful sensitivity sweeps include varying inlet velocity to see where shear drops below the removal threshold, varying surface temperature to locate where supersaturation risk peaks, and sweeping the fouling factor itself to see how sensitive your Uf really is to the assumption you made at design time.
The Jewlz Heat Exchanger Optimization tools and the Thermalysis Toolkit are built for exactly these sensitivity studies, letting engineers test flow distribution and geometry changes before committing to a physical retrofit.
Pro Tip: *Run the fouling-factor sweep before you order new hardware.
Where Fouling Prevention Is Headed Next
Coatings and surface engineering are the most active research area right now, and for good reason: a coating that lowers surface free energy delays crystal adhesion without touching process chemistry. But matching a coating to metallurgy and temperature limits is still more art than checklist, which is why many of these treatments remain closer to research than routine field practice. Online cleaning tech has plateaued too. Acoustic and electric devices show inconsistent results because nobody has paired them with real-time monitoring that proves they’re working. The honest barrier to adoption isn’t the science, it’s retrofit cost and the environmental limits on the chemicals plants are still allowed to dose.
— Joel
How Jewlztech Helps You Get Ahead of Fouling
Most engineers discover a fouling problem after it’s already cost them a cleaning cycle. Jewlztech’s approach is to test the fouling scenario before it happens, using physics-based simulation instead of waiting for the ΔP alarm. The Heat Exchanger Design Optimization tools let you run fouling-sensitivity sweeps, compare plate patterns or tube layouts under low-shear conditions, and check how a cleaning-driven geometry change actually affects flow distribution, all before you touch the physical unit.
The broader Thermalysis Toolkit gives you the conduction, convection, and radiation models plus a built-in material property database, so you’re not rebuilding basic thermal calculations from scratch every time a fouling assumption changes. If you’re sizing a new exchanger or troubleshooting a fouled one right now, start with a velocity and fouling-factor sensitivity run on the engineering toolkit and see how much margin your current design assumption is actually buying you.
Sources
FAQ
What Is the 10/13 Rule for Heat Exchangers?
It’s not a formal engineering standard, more a rule of thumb some operators used to trigger a cleaning decision alongside proper trend data.
How Do You Remove Fouling in Heat Exchangers?
Removal depends on deposit type: acid cleaning dissolves mineral scale, alkaline cleaning breaks down organic and biological deposits, and mechanical methods like high-pressure jetting, brushing, or pigging clear hardened or thick deposits. Online methods such as sponge-ball systems can suppress buildup between scheduled offline cleanings but don’t replace them.
What Is a Typical Fouling Factor for a Heat Exchanger?
Fouling factors vary by service and fluid, but plate heat exchangers often use margins in the 5 to 10% range thanks to their higher wall shear stress, while shell-and-tube designs on the same service typically need a larger margin. The right value comes from your actual fluid chemistry and cleaning interval, not a single universal number.
What’s the Difference Between Fouling and Scaling in Heat Exchangers?
Scaling is one specific type of fouling, the crystallization of dissolved minerals like calcium carbonate onto the heat-transfer surface. Fouling is the broader category that also includes particulate deposits, biological growth, chemical reaction products, corrosion layers, and solidified process fluid, meaning every scale problem is fouling, but not every fouling problem is scale.
Can Simulation Help Predict Fouling Before It Happens?
Yes. Sensitivity studies that vary velocity, surface temperature, or the assumed fouling factor can reveal low-shear zones and hot spots likely to foul first, letting engineers compare design changes virtually before committing to hardware. Tools like the Jewlz Heat Exchanger Optimization software are built for exactly this kind of pre-emptive analysis.
Recommended
Comments