
1D and 2D CFD in Excel: Reproduce a Double Pipe Heat Exchanger

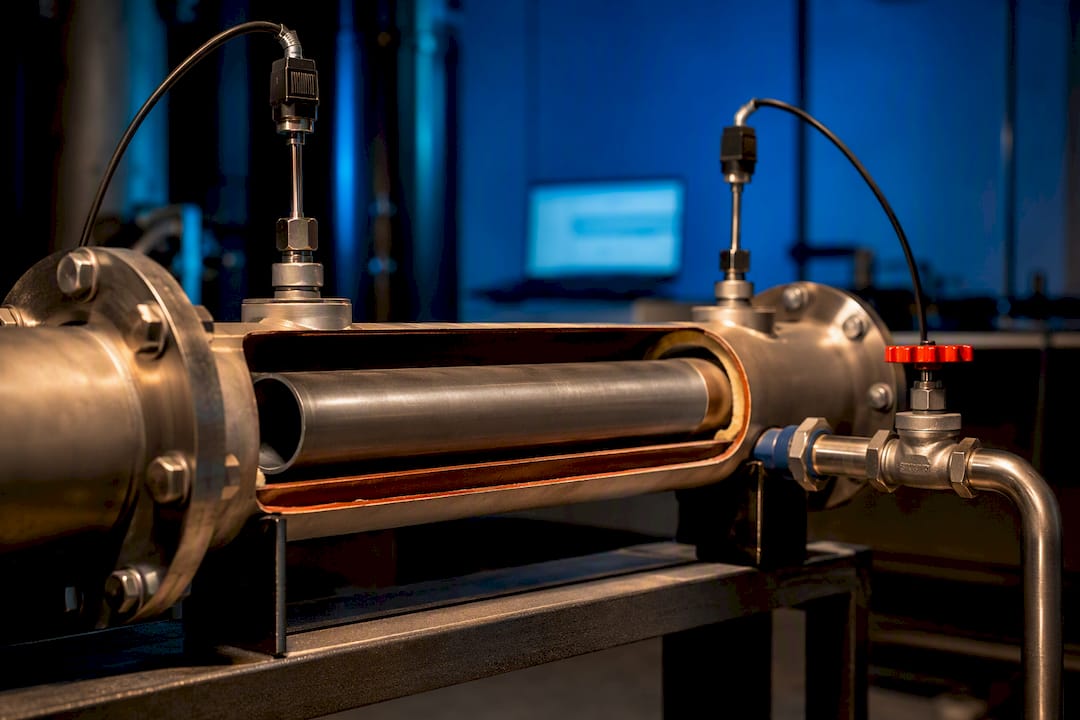
Yes. You can prototype CFD-style fluid and thermal analyses inside Excel using the Solver add-in, VBA, and property add-ins like Thermax. It works best for white-box learning, rapid design-space exploration, and 1-D or 2-D structured problems, not high-fidelity 3-D turbulent flow. To start, you need a mesh laid out on a sheet, a property table, discretized governing equations in formulas, and Solver configured for your target variable.
TL;DR:
Excel-based CFD modeling works best for simple, structured 1-D or 2-D problems like pipe networks and conduction slabs, not complex 3-D turbulence.
Building a reliable model requires proper meshing, discretization, boundary condition implementation, solver configuration, and validation steps like mesh sensitivity checks.
Solver modes should be chosen based on problem smoothness: GRG Nonlinear for differentiable issues and Evolutionary for discontinuous or tricky functions.
VBA is crucial for automating property lookups, iterative calculations, and batch runs, reducing errors compared to manual formula implementation.
For complex geometries or turbulence, commercial CFD software is necessary, but Excel excels at early-stage design, sensitivity analysis, and educational purposes.
Table of Contents
Required Excel Components for CFD Modeling in Excel
Before building anything, gather the right pieces. CFD modeling in Excel leans on native features most engineers already know, plus a few add-ins that make property lookups and non-linear solves tractable.
Excel’s array functions, MMULT and MINVERSE, solve the coupled linear systems that show up once you discretize a domain into a structured mesh. Circular calculations (with iterative calculation mode turned on) can help with certain feedback loops, though most experienced modelers avoid them in favor of explicit iteration schemes that are easier to debug. Charting handles visualization once you have results.
Solver runs in three modes: GRG Nonlinear for smooth, differentiable problems; Evolutionary for messy, discontinuous, or highly non-linear objective functions; and Simplex LP for strictly linear cases. Nonlinear heat-transfer and fluid-flow problems typically need GRG Nonlinear or Evolutionary, depending on how well-behaved the equations are.
VBA earns its place when formulas alone get unwieldy. Use it for user-defined functions (Colebrook friction factor, property interpolation), for automating batch runs across a parameter sweep, and for logging iteration history. Property add-ins such as Thermax matter because manually re-entering fluid properties for every temperature is slow and error-prone. A built-in property database with proper unit handling saves hours and cuts a common source of silent errors.
Before you write a single formula, assemble:
An input workbook template with clearly labeled cells for boundary conditions and geometry
A property table (density, viscosity, thermal conductivity, specific heat) with unit labels
A computation sheet holding your discretized equations
A dedicated results sheet with charts
Versioned backups, since Solver runs can overwrite good data if you are not careful
How Do You Build a CFD Model in Excel Step by Step?
The workflow for CFD modeling in Excel follows the same logical order every time, whether you are solving a pipe network or a 2-D conduction problem.
Map the domain to a mesh. Lay a logically rectangular grid directly onto the spreadsheet, with each cell in a defined range corresponding to a physical mesh point. This is the core technique behind most published spreadsheet CFD approaches: rows and columns become your i and j indices.
Choose your discretization. Finite-difference approximations replace derivatives with formulas referencing neighboring cells. For flow problems, finite-volume balances (mass in equals mass out, plus source terms) tend to be more physically intuitive on a sheet.
Implement boundary conditions. A Dirichlet condition is just a fixed value typed into an edge cell or referencing an input parameter. A Neumann condition (a fixed flux or zero-gradient wall) usually needs a formula that mirrors the adjacent interior cell rather than a hardcoded number. Complex BCs sometimes need a staged solve: fix the boundary, solve the interior, then update the boundary from interior results.
Configure Solver. Set your target cell (often an error residual or an objective like effectiveness), pick your decision variables (flow rates, geometry, a friction factor), and add physical constraints so Solver doesn’t wander into negative pipe diameters or impossible temperatures.
Automate with VBA. Write UDFs for Colebrook’s equation or thermophysical properties, then wrap the whole calculation in a macro that runs Solver across a batch of scenarios and logs each result to a table.
Watch for numerical stability. Under-relax slow-converging updates, track residuals explicitly in a cell you can chart over iterations, and pick a time step conservative enough that transient solves don’t blow up.
Pro Tip: Never nest an iterative friction-factor solve inside a circular spreadsheet formula. Write it as a VBA UDF instead. Keeping the iteration inside a single function call avoids Excel’s circular-reference warnings entirely and converges far more predictably than toggling iterative calculation mode.
Worked Example: A Double-Pipe Heat Exchanger in Excel
A double-pipe heat exchanger is the classic reproducible example in the literature, and it maps cleanly onto a four-sheet workbook layout:
Input sheet: flow rates, inlet temperatures, and exchanger length
Property table: fluid properties as a function of temperature
Compute sheet: the discretized energy balance, using either the LMTD (log mean temperature difference) method or NTU (number of transfer units)
Results sheet: outlet temperatures, effectiveness, and a temperature-profile chart
One published example set Solver’s objective to maximize annualized energy savings, with pipe diameter as the primary decision variable, subject to physical limits on velocity and pressure drop. Solver found the optimal diameter, and a VBA lookup function called Schedule40 mapped that continuous optimum to the nearest standard commercial pipe size, since no supplier sells a pipe at an arbitrary decimal diameter.
When Solver finishes, check the convergence report first. A “Solver found a solution” message with a small final objective change is a good sign. If Solver reports that it “could not find a feasible solution,” your constraints are likely contradictory (velocity floor above pressure-drop ceiling is a common culprit). If it converges but the answer looks physically wrong, check whether Solver landed on a local optimum. This is exactly where switching from GRG Nonlinear to Evolutionary mode often unsticks the calculation, since Evolutionary search handles non-smooth objective surfaces better.
Scaling this same layout to a pipe network with more nodes mostly means adding rows to the property and compute sheets and expanding the mass-balance formulas. The structure doesn’t change. Swapping fluids just means updating the property table, provided your formulas reference that table rather than hardcoded constants.
When Should You Move Beyond Excel for CFD?
Excel earns its keep on structured 1-D and 2-D problems: pipe networks, conduction slabs, parametric heat-exchanger studies, and anything you’re building primarily to teach or learn the underlying numerics. It is genuinely strong for optimization sweeps where you want to see how an output shifts as three or four inputs change.
It is a poor fit once your geometry stops being structured. Unstructured 3-D flows, detailed turbulence modeling with RANS or LES closures, and multiphase or multicomponent physics with complex interface tracking all exceed what a spreadsheet can reasonably represent.
A short decision checklist before committing to a spreadsheet build:
How complex is the geometry? Anything beyond simple rectangular or cylindrical domains fights the sheet-based mesh.
What fidelity does the answer actually need? A rough sizing estimate versus a certification-grade result are different jobs entirely.
Are there regulatory or certification requirements? Those almost always demand a validated commercial CFD package.
What compute resources are available? Excel doesn’t need a workstation, but it also can’t parallelize the way dedicated solvers can.
The most practical strategy treats Excel as a pre-sizing and sensitivity-analysis stage, then hands the promising design off to a commercial CFD package for final validation on complex geometry or turbulent regimes.
How Do You Verify an Excel CFD Model Is Actually Correct?
Trusting a spreadsheet result means running the same checks you’d expect from any numerical solver, just organized manually.
Run a mesh-sensitivity study. Double the number of mesh points and re-solve. If your key output barely moves, you’re likely mesh-independent; if it swings noticeably, refine further.
Compare to an analytical solution. Simple conduction slabs and fully developed laminar pipe flow have closed-form answers. Check your spreadsheet against a known conduction result before trusting it on a problem with no clean answer.
Track residuals explicitly. Plot the iteration-to-iteration change in your target variable and define a numeric stopping threshold rather than eyeballing convergence.
Document assumptions and version everything. Note property sources, boundary-condition choices, and Solver settings in the workbook itself, and unit-test any VBA UDFs against hand-calculated values.
Pro Tip: Keep a small “known answer” tab in every CFD workbook. Run your UDFs against a textbook case with a published result each time you modify the sheet, so a broken formula shows up immediately instead of three tabs downstream.
Why Building CFD Models by Hand in Excel Still Matters
Most engineers reach for a GUI-based CFD package because it’s faster, and for production work, it usually should be. But something gets lost when the mesh, the discretization, and the iteration are all hidden behind a “solve” button. Building a model cell by cell in Excel forces you to confront the actual numerics: what a residual means, why under-relaxation matters, where a boundary condition physically lives in your equations.
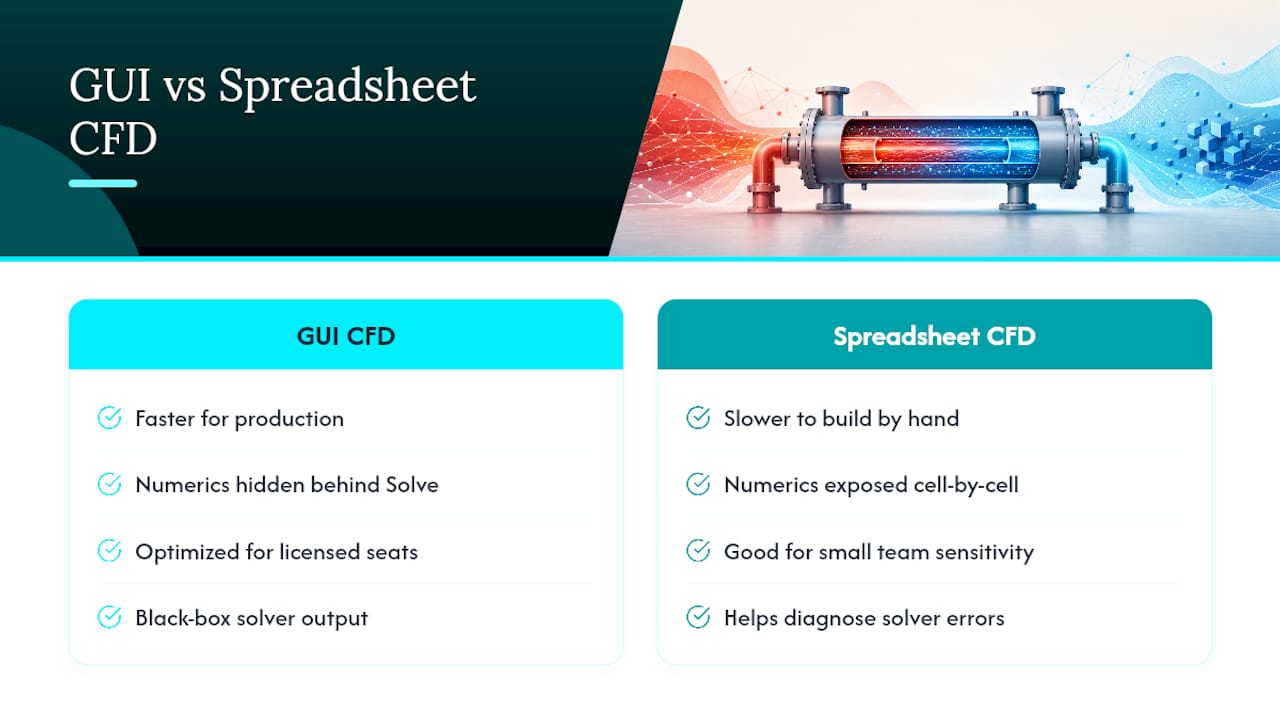
That white-box exposure is why spreadsheet CFD keeps showing up in engineering curricula. It produces engineers who can diagnose a commercial solver’s weird output later, because they’ve debugged the same categories of error by hand. It’s also genuinely useful outside the classroom: a small design team doing early-stage sensitivity analysis doesn’t need a licensed CFD seat for every “what if we changed the pipe diameter” question.
Jewlz Technologies builds thermal management and CFD tools around exactly this philosophy, and its technical writing on CFD software costs and governing equations reflects the same instinct: show the mechanics, not just the output.
— Joel
Get the Jewlz Engineering Toolkit for Excel-Based CFD
Building the workbook structure described above from scratch takes real time. Setting up property tables, wiring discretized equations correctly, and configuring Solver without a reference point is where most self-built spreadsheets go wrong before they produce a usable result.

The Jewlz Engineering Toolkit gives you downloadable Excel workbooks with a built-in property database, pre-structured compute sheets, and example models covering conduction, convection, radiation, and fluid flow, so you’re adapting a working template instead of starting from a blank grid. It supports variable material properties across a wide temperature range and multiple heat transfer modes in one place, which is exactly the setup this article walked through building manually. If you’re working on a heat exchanger design, the heat exchanger optimization tools extend the same Solver-based approach shown in the double-pipe example. Download the toolkit and open the example workbook first. It’s the fastest way to see how the mesh, property table, and Solver setup fit together before you build your own.
Sources
FAQ
Can Excel Actually Solve CFD Equations?
Excel can solve discretized versions of fluid and heat-transfer equations using finite-difference or finite-volume approximations, paired with Solver for non-linear systems. It handles structured 1-D and 2-D problems well but isn’t built for unstructured 3-D turbulent flow.
Do I Need VBA for CFD in Excel?
VBA isn’t strictly required for simple cases, but it becomes essential once you need iterative property lookups, Colebrook friction-factor solutions, or batch runs across multiple scenarios. Pure formulas can handle basic discretized models on their own.
Which Solver Method Should I Use for CFD Problems?
Use GRG Nonlinear for smooth, well-behaved non-linear problems, and switch to Evolutionary when the objective function is discontinuous or has multiple local optima. Simplex LP only applies to strictly linear systems.
Is Excel a Substitute for Commercial CFD Software?
No. Excel works well for pre-sizing, parametric studies, and education, but complex geometry, turbulence modeling, and multiphase physics call for a dedicated commercial CFD package.
What Does the Jewlz Engineering Toolkit Add to Excel-Based CFD?
It provides ready-made Excel workbooks with a built-in property database, structured compute sheets, and example models for thermal, CFD, and pressure vessel analysis, cutting the setup work described in this article. Pricing details are available on the toolkit page.
Recommended
Comments