
Boiling Heat Transfer Basics for Engineers
- Jewlz Technologies

- 6 days ago
- 16 min read
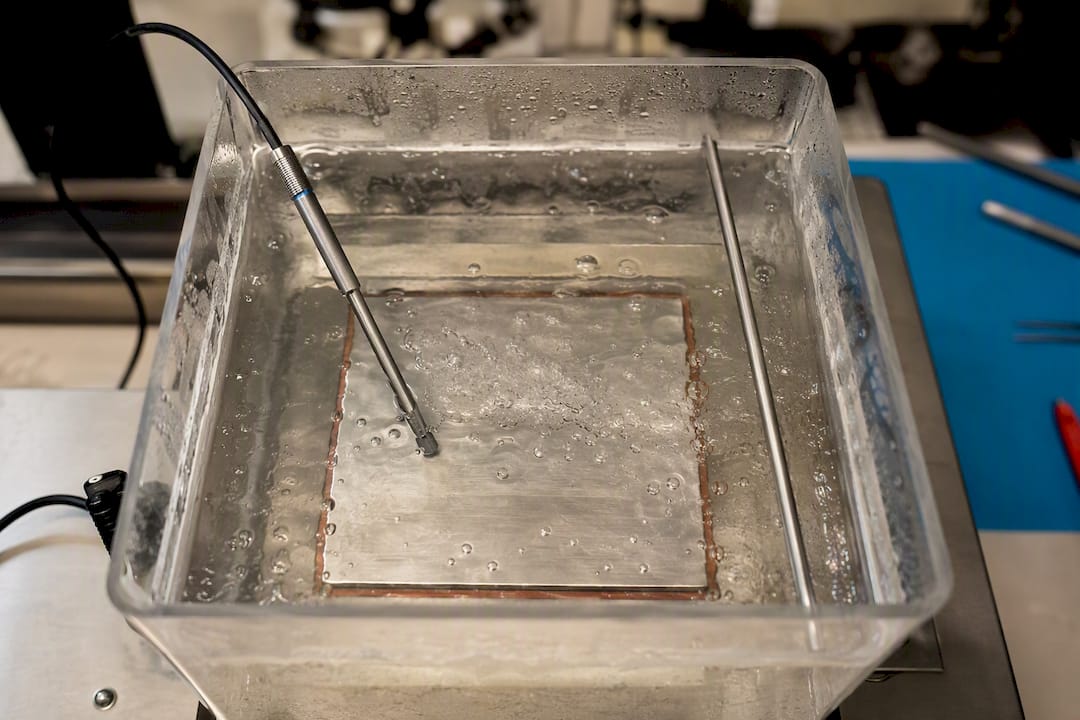
Boiling heat transfer moves large amounts of thermal energy through liquid to vapor phase change, and it does this at heat transfer coefficients that convection alone can rarely match. The single constraint that governs every practical design is Critical Heat Flux (CHF), the point past which a surface stops wetting properly and wall temperature spikes fast enough to damage equipment. Before you trust a design, check three things: your operating heat flux against a CHF estimate with real margin, how pressure and subcooling shift that margin, and whether your surface and flow conditions match the correlation you’re using to predict it.
Compare your operating heat flux to CHF using the Nukiyama boiling curve as your mental map, not just a single number.
Check pressure and subcooling. Both move the CHF point and the shape of the curve substantially.
Verify your surface finish and flow regime match the validated range of whatever correlation you’re relying on.
A useful anchor number: for saturated pool boiling of water at 1 atmosphere, CHF lands around 1,000 kW/m² on a plain surface, though that figure moves a lot with surface roughness, wettability, and geometry.
Key Takeaways
Boiling heat transfer delivers high heat removal through phase change, and every practical design decision comes down to managing margin against Critical Heat Flux.
Point | Details |
CHF is the design limit | Treat CHF, not average heat flux, as the number that protects hardware from a boiling crisis. |
Regime dictates approach | Classify your system as pool or flow boiling first, since mechanisms and correlations differ sharply between them. |
Five mechanisms drive nucleate boiling | Microlayer evaporation and transient conduction from rewetting typically dominate at high heat flux. |
Correlations need validation | Match Rohsenow, Cooper, Chen, or Gungor–Winterton type formulas to your fluid and range before trusting the output. |
Toolkit for fast checks | Jewlztech’s Thermalysis Toolkit runs correlation-based HTC and CHF estimates with a built-in property database for quick design validation. |
Table of Contents
What Is Boiling Heat Transfer and Why Does the Curve Matter?
Boiling heat transfer happens when a heated surface raises liquid temperature past its local saturation point, generating vapor bubbles that carry latent heat away far more efficiently than a fluid moving without phase change. That’s the core distinction from ordinary convection: convection relies on sensible heat and bulk fluid motion, while boiling adds the latent heat of vaporization on top, which is why a boiling surface can carry ten times or more the heat flux of a single-phase liquid flow at a comparable temperature difference.
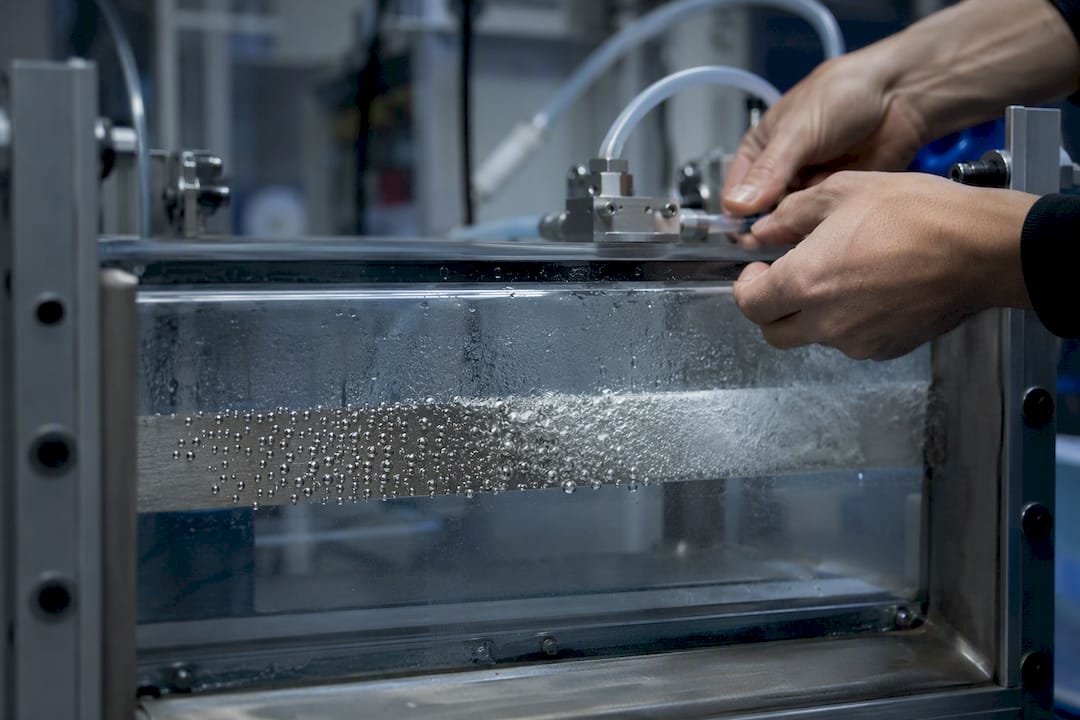
Two broad setups define almost everything downstream: pool boiling, where the liquid is stagnant and buoyancy alone drives bubble departure, and flow boiling, where an external pump or pressure gradient pushes liquid past the heated surface. Within either setup, engineers classify boiling into regimes based on how the surface interacts with vapor: nucleate boiling (discrete bubbles at active sites), transition boiling (an unstable mix of nucleate and film behavior), film boiling (a continuous vapor blanket insulating the surface), and bulk boiling (where the liquid core itself reaches saturation temperature, common in flow systems).
Regime | Typical Setting | Common Engineering Use |
Pool nucleate boiling | Stagnant liquid, submerged heater | Kettle reboilers, immersion cooling for electronics |
Flow (forced convective) boiling | Liquid pumped through a channel or tube | Boilers, refrigerant evaporators, some reactor coolant loops |
Transition boiling | Narrow band between nucleate and film | Rarely a design target; avoided due to instability |
Film boiling | Vapor blanket fully covers surface | Quenching processes, some emergency cooling scenarios |
A few concrete mappings help this stick:
Electronics cooling and immersion server tanks lean on pool nucleate boiling with dielectric fluids.
Industrial boilers and refrigerant evaporators depend on flow boiling because flow configurations deliver the highest heat transfer coefficients used industrially.
Boiling water reactors (BWRs) run flow boiling in fuel channels, where CHF margin is a safety-critical design parameter, not just an efficiency concern.
If you’re new to how boiling fits among the other heat transfer mechanisms, our practical engineering guide to heat transfer covers conduction and convection basics that make this comparison land more clearly.
How Do You Read the Nukiyama Boiling Curve?
The Nukiyama boiling curve plots surface heat flux against wall superheat (the temperature difference between the heated surface and the fluid’s saturation temperature), and it tells you exactly which regime you’re in and what happens if you push past it. Every point on that curve corresponds to a different heat transfer coefficient and a different failure risk, which is why reading it correctly matters more than memorizing any single formula.
Here’s what each labeled region means for your design:
Onset of Nucleate Boiling (ONB): the wall superheat where the first vapor bubbles appear at active cavities on the surface; below this, you’re in single-phase natural convection.
Nucleate boiling region: heat flux rises steeply with modest increases in superheat, delivering the highest HTC on the curve. This is the region almost every practical design wants to operate in.
Critical heat flux point: the curve’s peak. Push wall superheat past this point and heat flux does not keep climbing. It can actually fall while wall temperature rockets upward.
Transition boiling: an unstable mix of nucleate and film behavior where heat flux decreases as superheat increases. Almost no equipment is designed to sit here.
Film boiling: a stable vapor layer blankets the surface, HTC drops sharply, and wall temperature can climb hundreds of degrees for the same heat input.
The boiling curve is not a smooth, forgiving slope. It has a cliff. Cross the CHF point and the same heater, same fluid, same flow rate suddenly needs a wall temperature hundreds of degrees higher to reject the same amount of heat. That cliff is why CHF margin, not average heat flux, is the number that actually protects hardware.
The illustrative water-at-1-atm figure of roughly 1,000 kW/m² for CHF is a starting benchmark, useful for sanity checks, but real surfaces, real geometries, and real subcooling levels can push that number up or down by a wide margin.
What Mechanisms Drive Heat Transfer in Nucleate Boiling?
Nucleate boiling achieves its high heat transfer coefficient through five overlapping mechanisms working together: natural convection between bubble events, micro-convection stirred up by bubble growth and departure, microlayer evaporation under growing bubbles, evaporation from the superheated liquid layer surrounding each bubble, and transient conduction during the brief rewetting that follows bubble departure. No single mechanism explains the whole effect. Their relative weight shifts with heat flux, fluid, and surface condition, and that’s exactly why nucleate boiling correlations built for one fluid often misfire on another.
Natural convection. Between active nucleation events, buoyancy-driven currents move heat away from the surface the same way they would in single-phase liquid. At low heat flux, before nucleation sites activate in force, this mechanism dominates.
Micro-convection from bubble motion. As a bubble grows and detaches, it drags surrounding liquid with it, creating localized stirring that pulls hot fluid away from the wall faster than bulk convection alone.
Microlayer evaporation. A thin liquid film forms trapped between the growing bubble base and the heated surface. That microlayer evaporates almost instantly because it’s so thin, and this mechanism is one of the primary contributors to high nucleate boiling HTC identified in pool boiling research.
Evaporation from the superheated thermal layer. The liquid immediately surrounding a bubble sits above saturation temperature. Some of that superheated liquid evaporates directly into the bubble as it grows, adding to the latent heat carried away.
Transient conduction during rewetting. The instant a bubble departs, cooler bulk liquid rushes in to replace it, briefly contacting the hot surface directly. That short burst of high-rate conduction, sometimes called quenching, repeats with every bubble cycle and adds up across thousands of cycles per second at high heat flux.
Pro Tip: If you need a fast way to estimate which mechanism dominates for your setup, look at bubble departure frequency and site density. High-frequency, high-density nucleation (typical of low-viscosity fluids like water and refrigerants at moderate to high heat flux) points to microlayer evaporation and transient conduction as the big contributors. Low-frequency, sparse nucleation, often seen with high-viscosity fluids or right near ONB, means natural convection and superheated-layer evaporation carry more of the load.
A few things worth remembering when you’re troubleshooting a boiling system that isn’t behaving as predicted:
Nucleation site density depends heavily on surface roughness and cavity geometry, not just fluid properties.
Pressure changes the size of cavities capable of nucleating bubbles, which shifts active site density even on an unchanged surface.
Bubble departure diameter and frequency vary by orders of magnitude between fluids like water, FC-72, and HFE7100, which is why a correlation tuned to one refrigerant rarely transfers cleanly to another.
Which Parameters Actually Move the Boiling Curve?
Seven variables control where your system sits on the boiling curve and how close you are to CHF: system pressure, degree of subcooling, applied heat flux, mass flux (in flow boiling), surface wettability and roughness, fluid properties like surface tension and latent heat, and channel or heater geometry. Each one pushes HTC and CHF in a specific, mostly predictable direction, which makes this list genuinely useful as a design checklist rather than trivia.
System pressure: higher pressure generally raises CHF and shifts the whole curve, because vapor density increases and bubble dynamics change.
Subcooling: liquid entering below saturation temperature delays bulk boiling and typically raises CHF, since more sensible heat has to be absorbed before vapor generation gets aggressive.
Heat flux: the direct driver of where you sit on the curve; higher flux, all else equal, means you’re closer to CHF.
Mass flux (flow boiling only): higher flow rates tend to raise CHF by sweeping vapor away from the surface faster, though the effect depends on flow regime.
Surface wettability and roughness: better wetting and moderate roughness typically raise nucleation site density and can delay CHF; poor wetting tends to trigger earlier dryout.
Fluid properties: lower surface tension and lower latent heat generally shift the curve toward lower heat flux operation overall.
Geometry: channel diameter, orientation, and heater shape all affect vapor removal paths and local hotspot risk.
Parameter | Effect on HTC | Effect on CHF |
Increasing pressure | Generally increases, then plateaus | Generally increases |
Increasing subcooling | Modest increase | Increases, often substantially |
Increasing mass flux (flow boiling) | Increases | Increases |
Improving wettability | Increases | Increases |
Two quick scenarios show why this matters in practice. First, raise system pressure on a refrigerant evaporator from a low operating point toward its critical pressure, and you’ll typically see the CHF margin widen, giving more headroom before dryout, though property changes near the critical point eventually work against you. Second, add subcooling to a pool boiling immersion cooling tank by running the dielectric fluid a few degrees below saturation, and you buy extra CHF margin without touching the heater at all, which is often the cheapest fix available when a design is running tight.
How Does a Boiling Crisis Happen and How Do You Prevent One?
Critical Heat Flux is the maximum heat flux a surface can sustain in nucleate boiling before a vapor blanket forms and insulates the surface from the liquid, triggering what’s called a boiling crisis. Two broad mechanism families explain how you get there. In flow boiling, Departure from Nucleate Boiling (DNB) happens at high heat flux and moderate to high liquid content, when bubbles crowd together fast enough to form a local vapor layer before the bulk liquid runs low. Liquid film dryout happens instead in annular flow at higher quality, where the thin liquid film coating the channel wall simply evaporates away entirely. In pool boiling, the Zuber hydrodynamic instability model and macrolayer dryout theory offer competing explanations, and which one actually governs depends on surface geometry and heat flux level.
Comparing the mechanisms:
DNB tends to dominate in subcooled or low-quality flow boiling at high heat flux, common in reactor fuel channels and high-power electronics cold plates.
Liquid film dryout tends to dominate in higher-quality annular flow, common in long evaporator tubes and refrigeration systems running toward the outlet.
Zuber’s hydrodynamic instability model treats CHF as a Taylor instability problem in the vapor jets leaving a pool boiling surface, useful for order-of-magnitude estimates on flat plates.
Macrolayer dryout theory instead attributes CHF to depletion of a thin liquid layer trapped beneath a vapor mass sitting on the surface, and it tends to match high-heat-flux pool boiling data better on structured or finned surfaces.
Crossing CHF is not a gentle event. Wall temperature can rise hundreds of degrees within seconds for the same heat input, and in real hardware that means burnout, material failure, or a rapid loss of structural integrity depending on the application. That’s why average heat flux across a whole heater is a dangerously incomplete safety metric: local hotspots can trigger a localized boiling crisis even when the bulk average sits comfortably below the nominal CHF value.
Practical mitigation strategies, roughly in order of how often engineers reach for them:
Build in margin against a CHF estimate, not just the mean operating flux, and treat local hotspots as a separate check.
Increase mass flux or flow velocity in flow boiling systems to sweep vapor away from the wall faster.
Improve surface wettability through coatings or surface treatment to delay dryout onset.
Redesign the flow path to avoid vapor pooling in low-velocity zones or geometric dead ends.
Add active monitoring, wall thermocouples, or heat-flux sensors near known hotspot regions for early warning.
For furnace and combustion-adjacent systems where surface overheating carries real equipment risk, this technical overview of critical heat flux and overheating prevention covers similar ground from an industrial equipment angle.
What Correlations Should You Use to Predict Boiling Heat Transfer?
Boiling correlations are empirical fits built from specific fluids, surfaces, and operating ranges, so the right choice depends entirely on matching your system to a correlation’s validated parameter space, not picking whichever formula looks most familiar. That single caution matters more here than in almost any other area of heat transfer, because predicting boiling performance still relies heavily on empirical correlations and targeted experimental validation rather than first-principles derivation.
Correlation | Best Used For | Typical Applicability Note |
Rohsenow | Pool nucleate boiling HTC | Requires fluid-surface empirical constant; accurate mainly within tested fluid/surface pairs |
Kutateladze / Zuber CHF scaling | Pool boiling CHF order-of-magnitude estimate | Good for flat plates and simple geometries; less reliable on structured surfaces |
Cooper | Pool nucleate boiling HTC across many fluids | Broadly applicable correlation, useful when fluid-specific data is unavailable |
Chen | Flow boiling HTC (combines nucleate and convective terms) | Widely used for saturated flow boiling in tubes; less accurate at very high or very low quality |
Gungor–Winterton type | Flow boiling HTC, refrigerant-focused | Common in HVAC and refrigeration design; validated mainly at refrigeration-scale conditions |
That last caveat about refrigeration-scale conditions is not a minor footnote. Flow boiling correlation datasets still cluster heavily around refrigeration-scale operating conditions, which means high-heat-flux applications like power electronics cooling or organic Rankine cycle systems often sit outside the range where these correlations were actually validated. Using Chen or Gungor–Winterton outside that comfort zone without cross-checking against test data is a common source of design surprises.
The practical approach most experienced engineers settle on: use a correlation to get a fast first-pass estimate, then validate against either published experimental data for a similar fluid and surface, or your own test rig if the stakes justify it. Empirical CHF relations are genuinely useful for trend analysis and order-of-magnitude sizing, but treating a single correlation’s output as a hard design number without a validation step is how CHF margins end up thinner than engineers think.
That usually means your operating point sits near the edge of one or both correlations’ validated range. Cross-check with in-situ visualization or a small-scale test rig before committing to a design margin.*
Does Surface Engineering Actually Improve Boiling Performance?
Surface topology and wettability can meaningfully raise nucleation site density and heat transfer coefficient, but the size of the benefit depends on operating pressure, fluid choice, and how well the surface’s cavity dimensions match the active nucleation range at your wall superheat. This isn’t a universal upgrade. It’s a tuning problem.
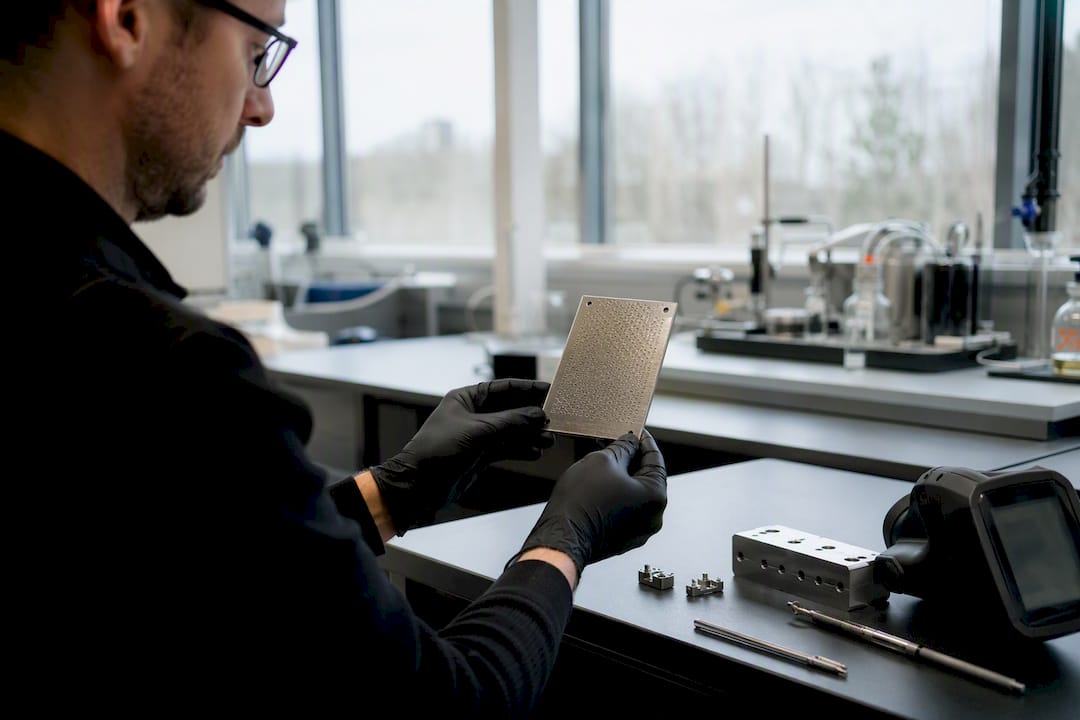
High-magnification in-situ boroscopy studies of etched, structured surfaces show a clear pattern: structured surfaces increased bubble nucleation density and raised HTC compared with plain surfaces, but the improvement varied significantly with etch chemistry and cavity size distribution. A surface engineered for one fluid at one operating superheat can underperform, or even lag a plain surface, once conditions shift outside its designed range.
Before and after a surface treatment, engineers typically see:
Higher nucleation site density and earlier ONB at lower wall superheat.
Increased HTC in the nucleate boiling region, sometimes substantially.
In flow boiling, delayed transition to annular flow, extending the useful nucleate boiling regime further down the channel.
Trade-offs in manufacturing cost, long-term fouling resistance, and durability under thermal cycling that plain surfaces don’t carry.
Pro Tip: Before scaling a structured surface from lab to production, confirm the cavity size range matches your actual operating wall superheat, not the superheat used in the original test. A structure tuned for a 10°C superheat can behave very differently at 25°C, since the pool of nucleation-active cavities shifts with superheat and pressure.
How Do Engineers Measure Boiling Heat Transfer in Practice?
Engineers rely on a handful of core measurement techniques to characterize boiling performance: instrumented heater strips, submerged pool heaters with embedded thermocouples, high-speed imaging to capture bubble dynamics, and dedicated heat-flux sensors calibrated against known references. Each method reports something slightly different, and mixing up what a sensor actually measures versus what you’re trying to infer is a common source of bad data.
Surface thermocouples report local wall temperature, not heat flux directly, so heat flux has to be back-calculated from a known conduction path.
High-speed imaging captures bubble departure diameter and frequency but says nothing about heat flux without a paired thermal measurement.
Spatial averaging across a heater can mask local hotspots that sit well above the average measured flux, which is exactly the blind spot that causes unexpected CHF events in the field.
Film boiling measurements are inherently transient and noisy right at the CHF transition, since the surface can flicker between nucleate and film behavior for a moment before settling.
The often-cited illustrative CHF value of roughly 1,000 kW/m² for water at 1 atm is a useful reference point for sanity-checking a calculation, but real measured values scatter widely depending on surface finish, orientation, and test rig geometry. Treat any single published CHF number as a starting estimate to validate, not a spec to design against without margin.
What’s the Right Way to Simulate Boiling Heat Transfer?
Pick your modeling approach based on the question you’re actually asking: use correlations for fast design trade studies where you need an HTC or CHF ballpark quickly, and reach for CFD with Volume of Fluid (VOF) or Level Set (LS) methods, or dedicated boiling models, when you need to resolve local hotspot risk that an average-flux calculation would miss entirely.
A practical modeling checklist:
Define the question first. A quick design comparison needs a correlation-based spreadsheet calculation, not a full transient CFD run.
If CFD is warranted, resolve mesh density near the wall carefully. Boiling physics happens in a thin layer, and an under-resolved near-wall mesh will misrepresent both nucleation and the microlayer evaporation contribution.
Choose time-stepping fine enough to capture bubble growth and departure cycles if you’re resolving individual bubbles, not just averaged wall heat flux.
Use temperature-dependent property tables rather than constant fluid properties, since surface tension and latent heat both shift meaningfully across realistic operating temperature ranges.
Couple the boiling model with conjugate heat transfer in the solid when wall conduction resistance is significant relative to the boiling-side resistance.
Validation matters as much as the model setup itself:
Run a mesh convergence study near the heated wall specifically, not just globally across the domain.
Compare model output against a targeted experiment or a well-validated correlation for a similar fluid and surface before trusting the results for a real design decision.
Run sensitivity tests on wall superheat and pressure, since boiling models are often more sensitive to these inputs than single-phase convection models are.
Our engineering guide to heat transfer modeling methods walks through mesh and solver considerations in more depth if you’re setting up a full CFD study rather than a quick correlation check.
Pro Tip: When simulating for CHF risk, report and check local peak heat flux at your finest mesh resolution, not the area-averaged flux across the whole heater surface. Averaged results routinely hide the hotspot that would actually trigger a boiling crisis in the field.
Practical Engineering Mindset for Designing With Boiling
I approach boiling heat transfer as a risk-management problem before it’s an efficiency problem. The upside of nucleate boiling, huge heat transfer coefficients for a modest temperature difference, is real, but the failure mode on the other side of CHF is abrupt enough that margin matters more than squeezing out an extra 10% of design performance.
My practical checklist runs roughly like this: start with a correlation-based CHF estimate early, add margin for local hotspots you haven’t modeled yet, validate against test data or a small rig before committing to a production design, and treat any single correlation’s output as a starting point rather than a verdict. Surface engineering and structured surfaces are worth exploring, but only after you’ve confirmed the base design has real margin against CHF under your actual operating conditions, not the conditions a correlation happened to be validated at.
A Practical Toolkit for Engineers Modeling Boiling Systems
Running correlation checks by hand across multiple fluids and operating points gets tedious fast, and it’s easy to lose track of which correlation applies where. The Thermalysis Toolkit from Jewlztech handles the conduction, convection, and phase-change calculations engineers need for exactly this kind of work, backed by a built-in material property database that saves you from hunting down surface tension and latent heat values fluid by fluid.

Two ways engineers put it to work:
Running quick design checks with correlation-based HTC and CHF estimates before committing to a full CFD study.
Estimating CHF guard-bands across a range of pressures and subcooling levels to see how much margin a design actually carries.
If you’re weighing whether a quick correlation calculation is enough or whether you need to hand geometry off to a full CFD workflow, the toolkit bridges that gap without locking you into a long setup process. Try the Thermalysis Toolkit directly and run your next boiling calculation against real property data instead of estimated constants.
Frequently Asked Questions
What is the main difference between boiling heat transfer and convection?
Convection moves heat through sensible energy carried by bulk fluid motion, while boiling heat transfer adds the latent heat of vaporization on top of that, which is why boiling typically achieves a far higher heat transfer coefficient than single-phase convection at a comparable temperature difference.
What causes Critical Heat Flux to be exceeded?
CHF gets exceeded when vapor generation outpaces the liquid’s ability to rewet the surface, either through Departure from Nucleate Boiling in flow systems or through liquid film dryout in annular flow, forming an insulating vapor layer that causes wall temperature to spike.
Which correlation should I start with for a nucleate boiling calculation?
Start with the Cooper correlation if you lack fluid-specific empirical constants, since it’s broadly validated across many fluids. Switch to Rohsenow only once you have the fluid-surface constant needed for that correlation’s accuracy.
Does higher pressure always increase CHF?
Generally yes, up to a point. Higher pressure tends to raise CHF because vapor density and bubble dynamics shift favorably, but very high pressures approaching the fluid’s critical point can start working against that trend as property differences between liquid and vapor shrink.
Why do boiling correlations disagree with each other so often?
Correlations are empirical fits built on specific fluids, surfaces, and heat flux ranges, so applying one outside its validated conditions introduces error that grows the further you stray from the original test data.
Sources
Recommended
Comments