
Emissivity Values: Quick Reference Guide for Engineers
- Jewlz Technologies

- Aug 14
- 10 min read
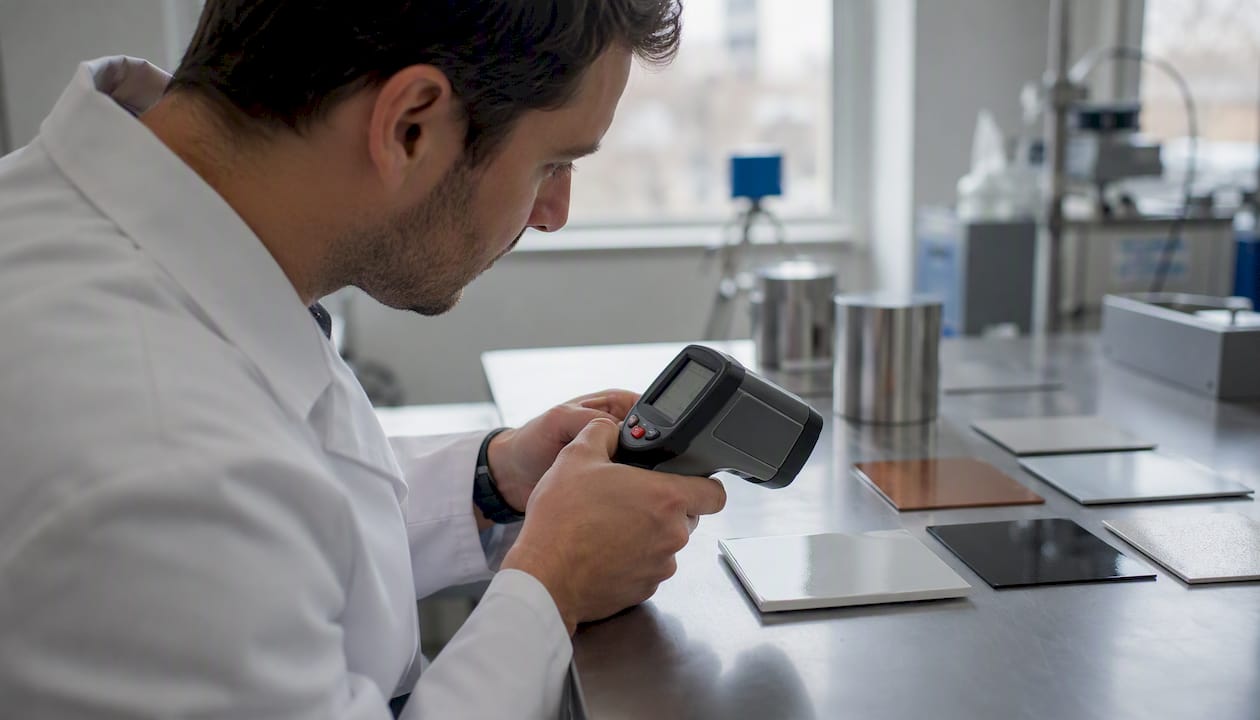
Emissivity runs on a scale from 0 to 1, where 1 represents a perfect blackbody radiator and 0 represents a perfect mirror. In practice, painted and organic surfaces typically fall between 0.9 and 0.97, rough or oxidized metals land somewhere in the 0.4–0.9 range, and polished metals often drop below 0.1. For most field inspections with an IR thermometer or thermal camera, start with 0.95 for any painted, coated, or organic surface, then verify by placing a piece of high-emissivity tape on the target and comparing readings.
Three sources engineers rely on most for quick lookups:
Fluke Process Instruments publishes metal-specific emissivity data with finish-level detail, noting that polished aluminum can be as low as 0.05 while oxidized aluminum climbs to 0.2–0.4.
ThermoWorks maintains a broad emissivity table covering paints, ceramics, concrete, metals, and organics, with an explicit note that tabulated values are starting points, not precision measurements.
NIST provides measurement-grade spectral and temperature-dependent data, including cryogenic cases where standard table values break down entirely.
Key Takeaways
Emissivity values from published tables are reliable starting points for high-emissivity surfaces but require field verification or spectral matching for metals, coated surfaces, and any sensor operating outside the 8–14 µm LWIR band.
Point | Details |
Default setting for painted/organic surfaces | Set 0.95 on your IR instrument; verify with high-emissivity tape if accuracy within ±5°C matters. |
Polished metals need contact sensors | Polished aluminum (ε ≈ 0.02–0.05) and polished copper (ε ≈ 0.02–0.05) carry too much reflected ambient radiation for reliable IR readings. |
Temperature and roughness shift metal emissivity | Stainless steel 316L emissivity rises at roughly 1.31×10⁻⁴ per °C; Ra and oxidation state shift the baseline significantly. |
Match emissivity data to your sensor band | A value valid at 1 µm can be wrong at 8–14 µm; always confirm the spectral range of your instrument before using a table value. |
Jewlztech Thermalysis Toolkit | Run a ±emissivity parametric sweep to quantify temperature uncertainty before committing to a measurement campaign. |
Table of Contents
What are the emissivity values for common materials?
The table below covers the materials engineers encounter most often. Values reflect total hemispherical emissivity at near-ambient temperatures unless noted. Treat every range as a guide; surface history, finish, and sensor band all shift the real number.
Material / Surface | Typical Emissivity Range | Key Notes |
Flat paint (any color) | 0.90–0.97 | Color has almost no effect in LWIR; finish matters far more |
Anodized aluminum | 0.9–0.95 | Anodizing raises emissivity dramatically vs. polished base |
Polished aluminum | 0.02–0.05 | Highly sensitive to contamination; oxidation raises it fast |
Oxidized aluminum | 0.2–0.4 | Depends on oxide thickness and temperature |
Polished stainless steel | 0.15–0.2 | Rises with temperature; roughness adds significantly |
Rough/oxidized stainless steel | 0.5–0.6 | |
Polished copper | 0.02–0.05 | Extremely low; even fingerprints shift the reading |
Oxidized copper | 0.55–0.7 | Patina and oxide layer dominate |
Carbon steel (oxidized) | 0.9 | Mill scale pushes values high |
Polished gold | 0.02–0.03 | Used as a low-emissivity reference standard |
Concrete / stone | 0.9–0.95 | Reliable; use 0.90 as a safe default |
Brick | 0.9 | Relatively stable across temperatures |
Glass (flat, 8–14 µm) | 0.9–0.95 | Opaque in LWIR; reads surface temperature accurately |
Ceramics (unglazed) | 0.9–0.95 | Glazed ceramics vary; check glaze type |
Wood (dry) | 0.9–0.95 | Moisture content shifts this upward |
Soil / asphalt | 0.90–0.97 | High and stable; good for outdoor thermal surveys |
Water (liquid) | 0.95 | One of the most reliable natural emitters |
Ice | 0.96 | Slightly lower than liquid water but still very high |
Human skin | 0.97 | Consistent across skin tones in LWIR |
Sources for these ranges include Fluke Process Instruments, ThermoWorks, the Heat Exchanger Design Handbook, and Omega Engineering. The HEDH explicitly warns that large scatter arises from surface preparation and thermal history, which is why the same alloy can appear in multiple references with noticeably different numbers.
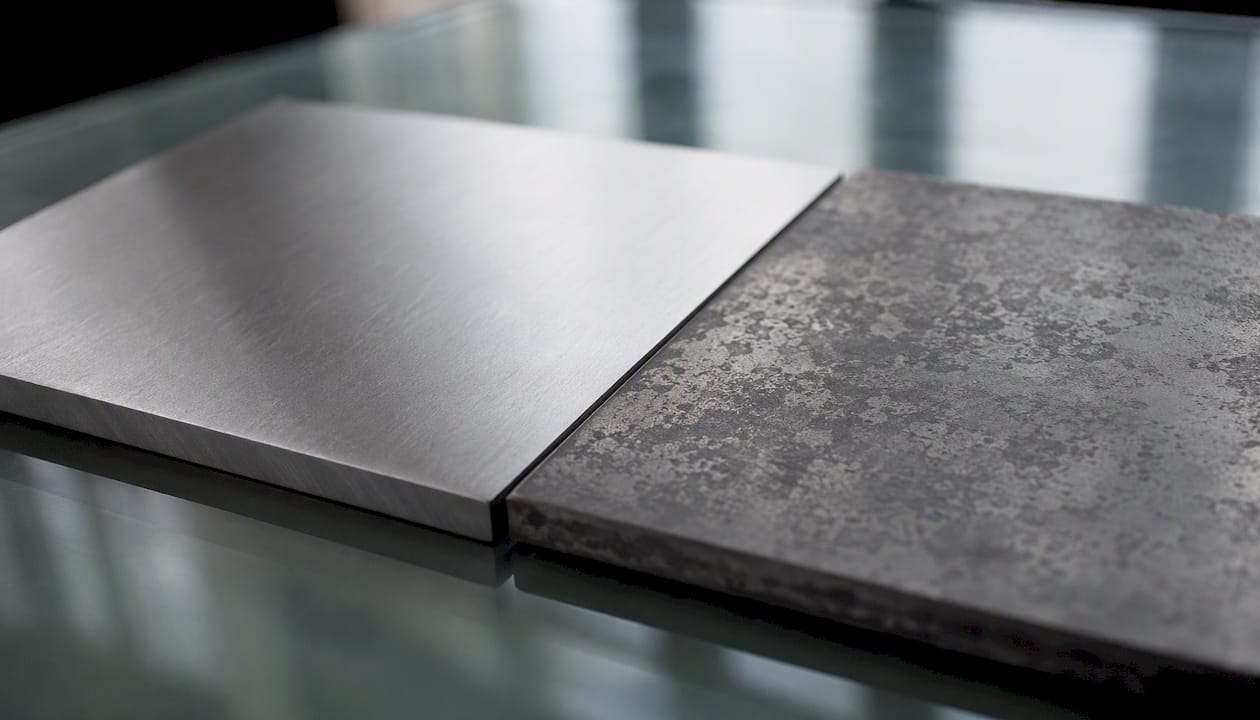
The polished-versus-oxidized gap for metals is the single largest source of field errors. Polished aluminum with very low emissivity and oxidized aluminum with moderate emissivity will produce a significant temperature reading error on the same part if you use the wrong value.
What physical factors change emissivity the most?
Surface finish is the dominant variable for metals. A mirror-polished surface reflects most incoming radiation and emits very little, while the same metal ground to a rough finish or left to oxidize in air behaves almost like a non-metal. The OSTI experimental study on stainless steel measured an approximate emissivity increase rate of 1.31×10⁻⁴ per °C for 316L, which means temperature alone shifts the reading meaningfully across a wide process range.
The main factors, ranked roughly by how much they move the number:
Oxide layer thickness: Even a thin oxide film on aluminum or copper raises emissivity from near-zero to 0.2–0.4. This is why freshly machined parts and aged parts of the same alloy give completely different readings.
Surface roughness (Ra): Higher Ra increases the effective surface area and traps radiation, raising emissivity. Sandblasted stainless steel reads 0.3–0.4 higher than its polished counterpart.
Temperature: For metals, emissivity generally rises with temperature. For non-metals, the relationship is more complex and sometimes inverted.
Measurement angle: Emissivity measured perpendicular to the surface (normal emissivity) differs from the hemispherical average. For most non-metals, the difference is small below 60°. For metals, it can be significant. Most IR instruments assume near-normal incidence, so keep your angle of view within 30° of perpendicular.
Layered or painted surfaces: A thin coat of paint over metal completely dominates the emissivity reading. The metal substrate becomes irrelevant once the coating is optically thick at the sensor’s wavelength, which for most paints happens at a film thickness of roughly 25 µm in the LWIR band.
Spectral/wavelength dependence: A value measured at 1 µm is not the same as one at 10 µm. Glass is nearly transparent at short wavelengths and nearly opaque in LWIR, flipping its apparent emissivity entirely depending on which sensor you use.
Pro Tip: Always check the spectral band of your IR instrument before pulling a table value. A shortwave pyrometer at 1 µm and an LWIR camera at 8–14 µm will see the same surface very differently. The IOPscience spectral emissivity study confirms that values valid at one wavelength band can be substantially wrong at another.
Directional versus hemispherical emissivity is a distinction that trips up even experienced engineers. Hemispherical emissivity integrates emission over all angles and is what most handbook tables report. Directional emissivity is what your IR camera actually measures. For most engineering materials at moderate temperatures, the two are within a few percent of each other at normal incidence, but for polished metals at oblique angles, the gap widens considerably.
How is emissivity measured in practice?
Four methods cover the range from quick field checks to lab-grade characterization.
Reflectometer / emissometer: An integrating-sphere reflectometer measures spectral reflectance directly, then derives emissivity as 1 minus reflectance (for opaque surfaces).
Comparative blackbody method: The sample is heated to a known temperature alongside a calibrated blackbody reference. Emissivity is calculated from the ratio of radiated power. This is the basis for most NIST-traceable calibrations and is standard in aerospace and cryogenics work.
Calorimetric / transient calorimetric: The sample is heated and allowed to cool; the cooling curve is compared against a model.
IR comparator with reference tape: The fastest field method. Apply a patch of high-emissivity tape (typically ε = 0.95) to the target surface, allow it to reach thermal equilibrium, then compare the IR reading on the tape versus the bare surface. Adjust the instrument’s emissivity setting until both readings match.
Field verification procedure:
Clean the target surface to remove loose contamination (do not polish it).
Apply a 2 cm × 2 cm patch of high-emissivity tape (ε = 0.95) and wait at least 3 minutes for equilibration.
Set the instrument emissivity to 0.95 and record the temperature over the tape patch.
Move the sensor to the bare surface immediately adjacent to the tape.
Adjust the emissivity setting until the bare-surface reading matches the tape reading.
Record the adjusted value. That is your working emissivity for this surface under these conditions.
This procedure works well for surfaces above 30°C above ambient. Below that threshold, small temperature gradients and reflected ambient radiation introduce enough noise to make the comparison unreliable.
How do you set emissivity on IR thermometers and thermal cameras?
Start with the surface category, not the material name. The finish and coating matter more than the alloy designation.
Quick-check routine:
Visually inspect the surface. Is it painted, coated, or organic? Use 0.95 as your starting point. Is it bare metal? Determine whether it is polished, brushed, or oxidized before picking a value.
Set the instrument to the category default from the list below.
Apply the tape-patch verification from the measurement section above if accuracy matters.
If the surface is bare polished metal and you cannot apply tape, use a contact thermocouple as the reference instead.
Recommended defaults by category:
Painted, coated, or powder-coated metal: 0.95
Concrete, brick, stone: 0.90
Wood, dry: 0.90
Unglazed ceramic: 0.90
Oxidized or rough steel: 0.80
Brushed stainless steel: 0.55 (verify; this varies widely)
Polished stainless steel: 0.15 (high uncertainty without verification)
Polished aluminum: 0.05 (contact sensor strongly preferred)
Water, skin, biological tissue: 0.97
Pro Tip: For polished metals, skip the IR thermometer entirely if you need accuracy better than ±5°C. A thermocouple or RTD is the right tool. For radiative heat-transfer calculations that include polished surfaces, treat the emissivity as a sensitivity variable and run a range.
Two additional warnings worth keeping in mind. First, spectral mismatch: if your camera operates at 3–5 µm and your table value comes from a total-hemispherical measurement, the numbers may not agree. Second, angle of view: beyond 45° from normal, emissivity for most metals drops, and reflected radiation from surrounding objects increases. Stay within 30° of perpendicular whenever possible.
Why does spectral emissivity matter more than most tables show?
Most published emissivity tables report total hemispherical emissivity, which integrates emission across all wavelengths and all angles. Your IR instrument does neither. It samples a specific spectral band at a specific angle. That mismatch is manageable for high-emissivity surfaces but can be severe for metals and specialized coatings.
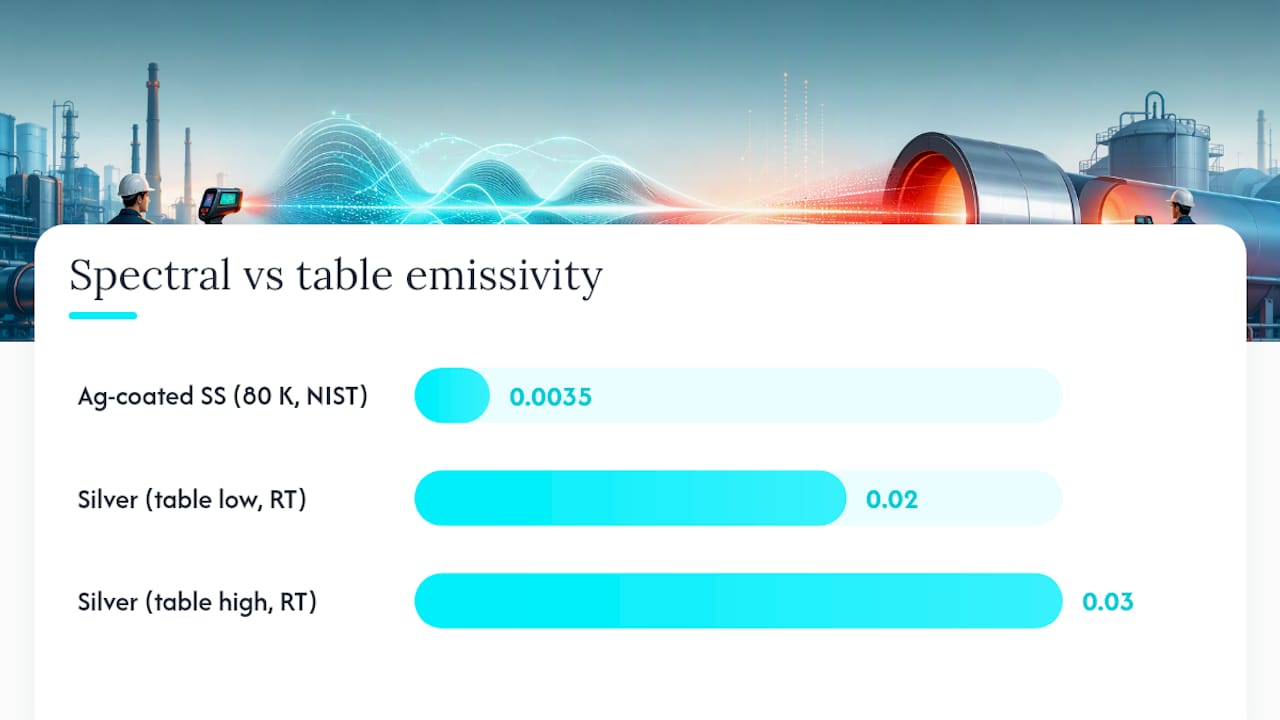
The clearest example comes from cryogenic applications. NIST measurements on silver-coated stainless steel for ITER thermal shields found emissivity as low as 0.0035 at 80 K. A generic metals table might list silver at 0.02–0.03 at room temperature. Using that table value for a cryogenic shield design would overestimate radiative heat load by a factor of 6 or more.
The wavelength effect shows up in everyday work too:
Glass: Nearly transparent at 1 µm (you are measuring through it to whatever is behind), nearly opaque at 8–14 µm (you are measuring the glass surface itself). Using a shortwave pyrometer on a glass pane gives you the temperature of whatever is inside the furnace, not the glass.
Plastics and thin films: Many polymers have strong absorption bands in the mid-IR. A polyethylene film that looks transparent to the eye is nearly opaque at 3.4 µm.
Silicon wafers: Emissivity at 1 µm is strongly temperature-dependent because of the bandgap; at room temperature silicon is nearly transparent, but above ~600°C it becomes opaque and emissivity rises sharply.
The IOPscience spectral emissivity study makes the point directly: values valid at one wavelength band are not necessarily valid at another. For any measurement where the material has known spectral features in the sensor’s band, use spectral emissivity data matched to that band, or measure it directly.
When a table value will mislead you: cryogenic coatings, thin films, semiconductors, glass in shortwave instruments, and any surface where the sensor band overlaps a strong absorption or reflection feature of the material.
When should you measure emissivity instead of using a table?
The answer depends on how much temperature error you can tolerate and how sensitive your system is to that error.
Decision workflow:
Low-accuracy check (±5°C or more acceptable): A table value is fine. Use the ranges from the quick-reference table above, pick the value closest to your surface condition, and proceed.
Medium-accuracy (±1–5°C): Run the tape-patch field verification. Takes 5 minutes and cuts your emissivity uncertainty from ±0.1 to roughly ±0.03.
High-accuracy or complex systems (sub-1°C, or layered/coated surfaces): Measure spectral emissivity with a reflectometer or emissometer, or run a sensitivity simulation to quantify how much the temperature result changes across the plausible emissivity range.
Sensitivity analysis is underused. Before committing to a measurement campaign, run a quick parametric sweep: if your system’s calculated heat flux or surface temperature changes by less than your acceptable error when emissivity varies across its full plausible range, you do not need to measure it precisely. If the result is sensitive, you do.
For practical heat-transfer applications where radiation is a significant mode, emissivity uncertainty often dominates the total error budget. That propagates directly into your heat-balance calculation.
The Jewlztech Thermalysis Toolkit supports parametric sensitivity studies where emissivity is treated as a variable across a defined range. For multi-mode heat-transfer problems where radiation matters, running a ±emissivity sweep in the toolkit takes minutes and tells you immediately whether you need a precise measurement or whether a table value is good enough for your accuracy requirement.
What engineers get wrong about emissivity in practice
The most common mistake is using a polished-metal table value for a surface that has been sitting in service for months. Polished aluminum at 0.05 is a lab condition. The same part after handling, light oxidation, and surface contamination in a real environment is closer to 0.15–0.30. That threefold difference produces a large temperature error when the surface is warm.
The second mistake is ignoring the sensor band. Engineers who are careful about emissivity values for LWIR cameras sometimes forget to check whether the same value applies to their shortwave pyrometer. For most non-metals at ambient temperatures, the error is small. For metals, glass, and semiconductors, it can be the dominant source of error in the measurement.
A practical priority list for any radiative measurement:
Match the emissivity source to your sensor’s spectral band.
Verify table values with a tape-patch test when accuracy matters.
Run a sensitivity simulation before deciding whether to invest in a precise measurement.
Using polished-metal table values for painted or oxidized surfaces is the single most common error in field thermography. The fix takes five minutes and a roll of high-emissivity tape.
The Thermalysis Toolkit handles emissivity as a variable, not a constant
When emissivity uncertainty is large enough to matter, the right move is a parametric sweep, not a single-point calculation. The Jewlztech Thermalysis Toolkit lets you define emissivity as a range and run conduction, convection, and radiation analysis across that range simultaneously.
The toolkit includes a built-in material property database, supports variable properties across a wide temperature range, and outputs results across all three heat-transfer modes in a single downloadable Excel-based tool. For engineers working on systems where radiation is a significant contributor, running an emissivity sensitivity sweep before finalizing a design or measurement plan is the kind of check that catches problems before they become field errors. Access the toolkit directly at Jewlztech and run your first parametric study.
Sources
Recommended
Comments